Passive DNS Timeline
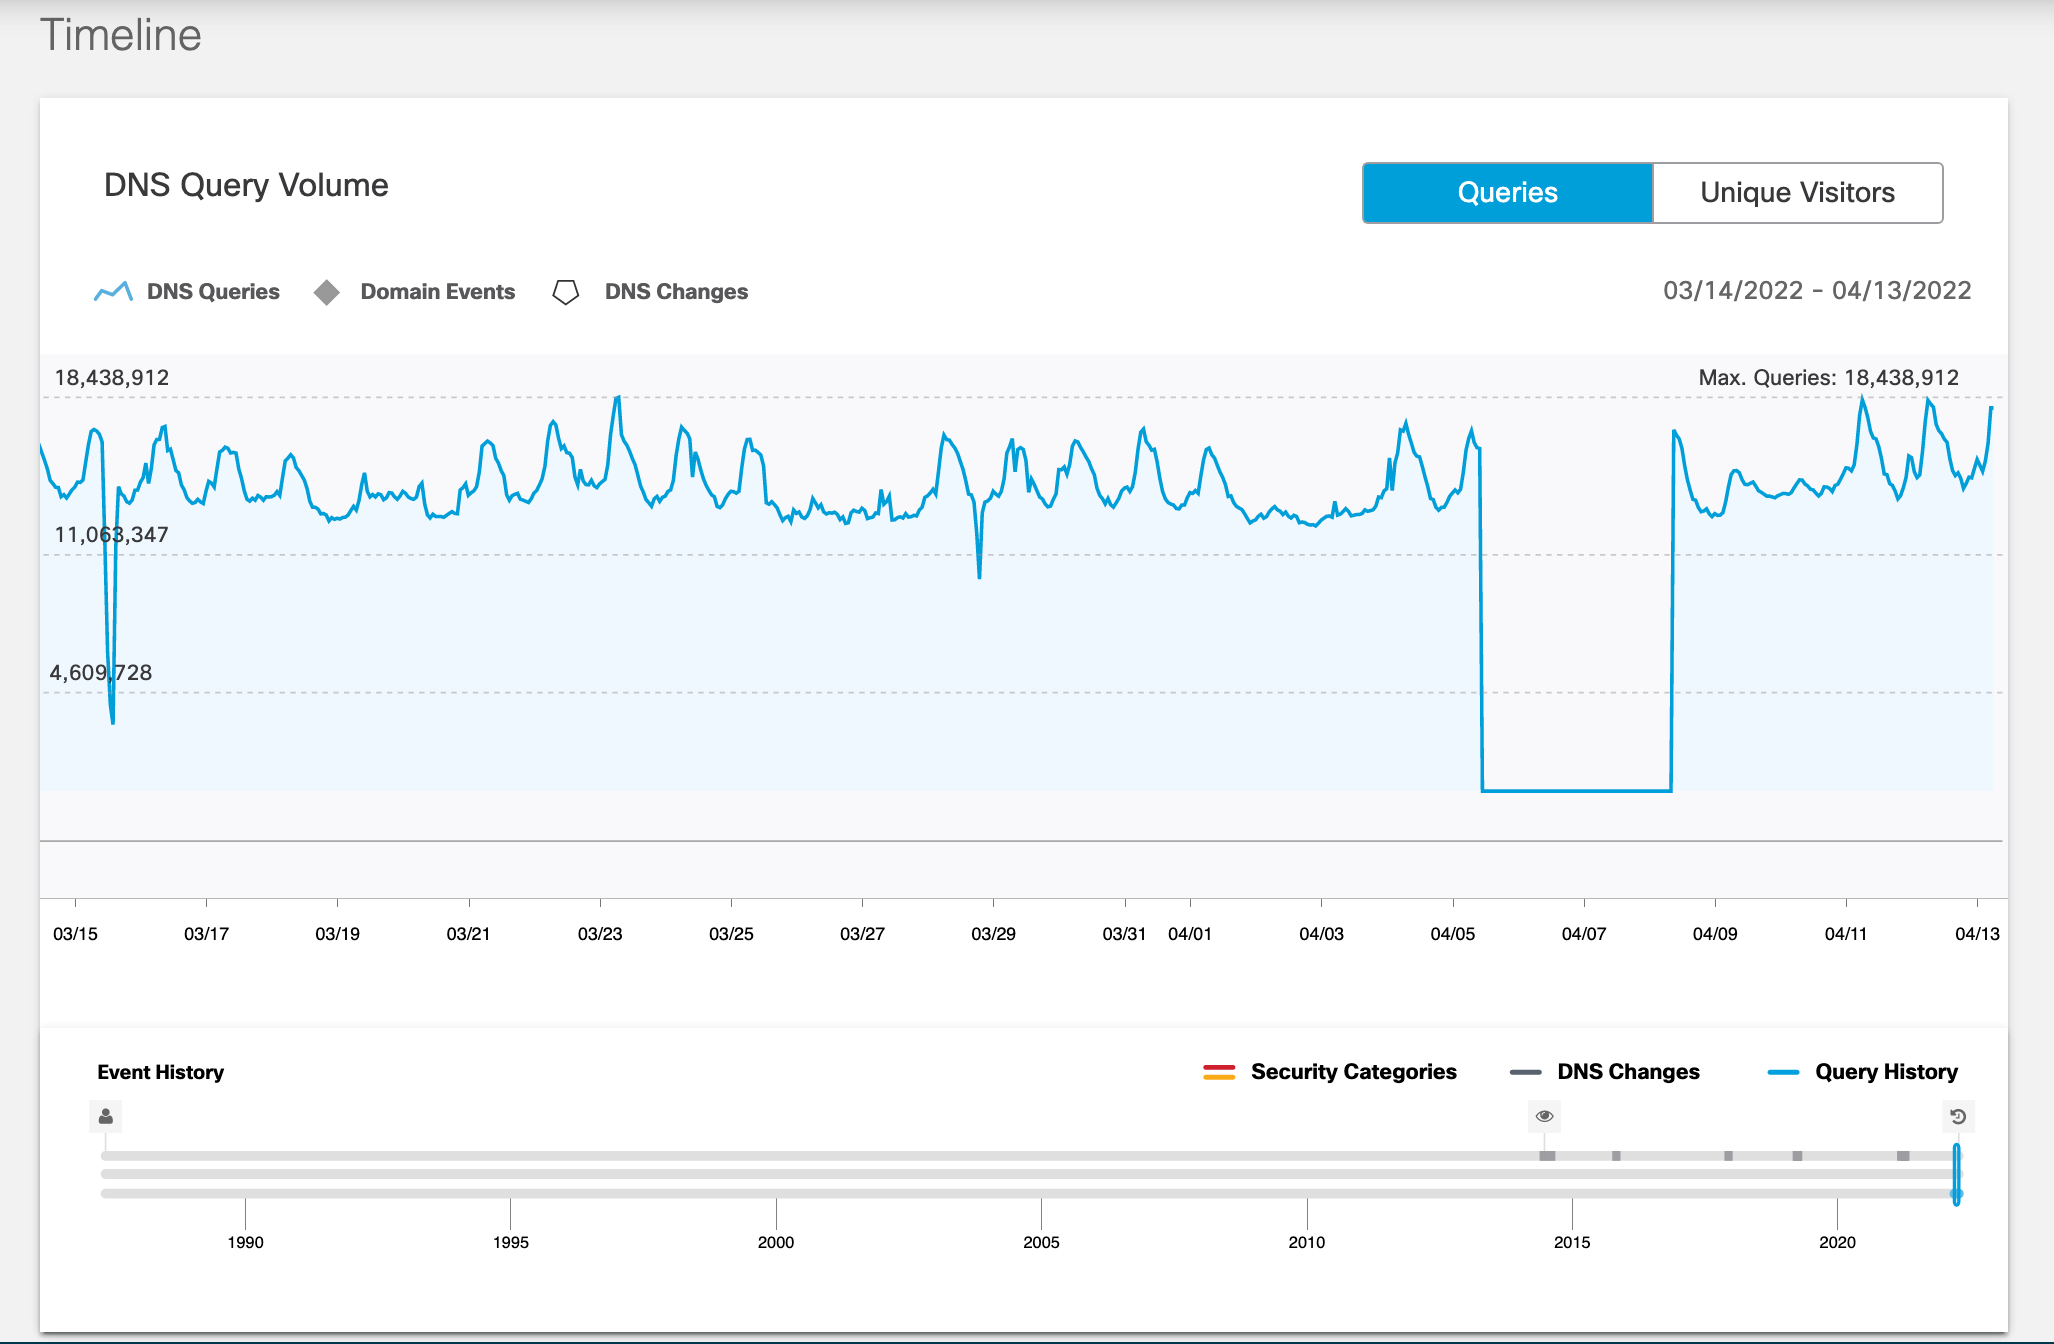
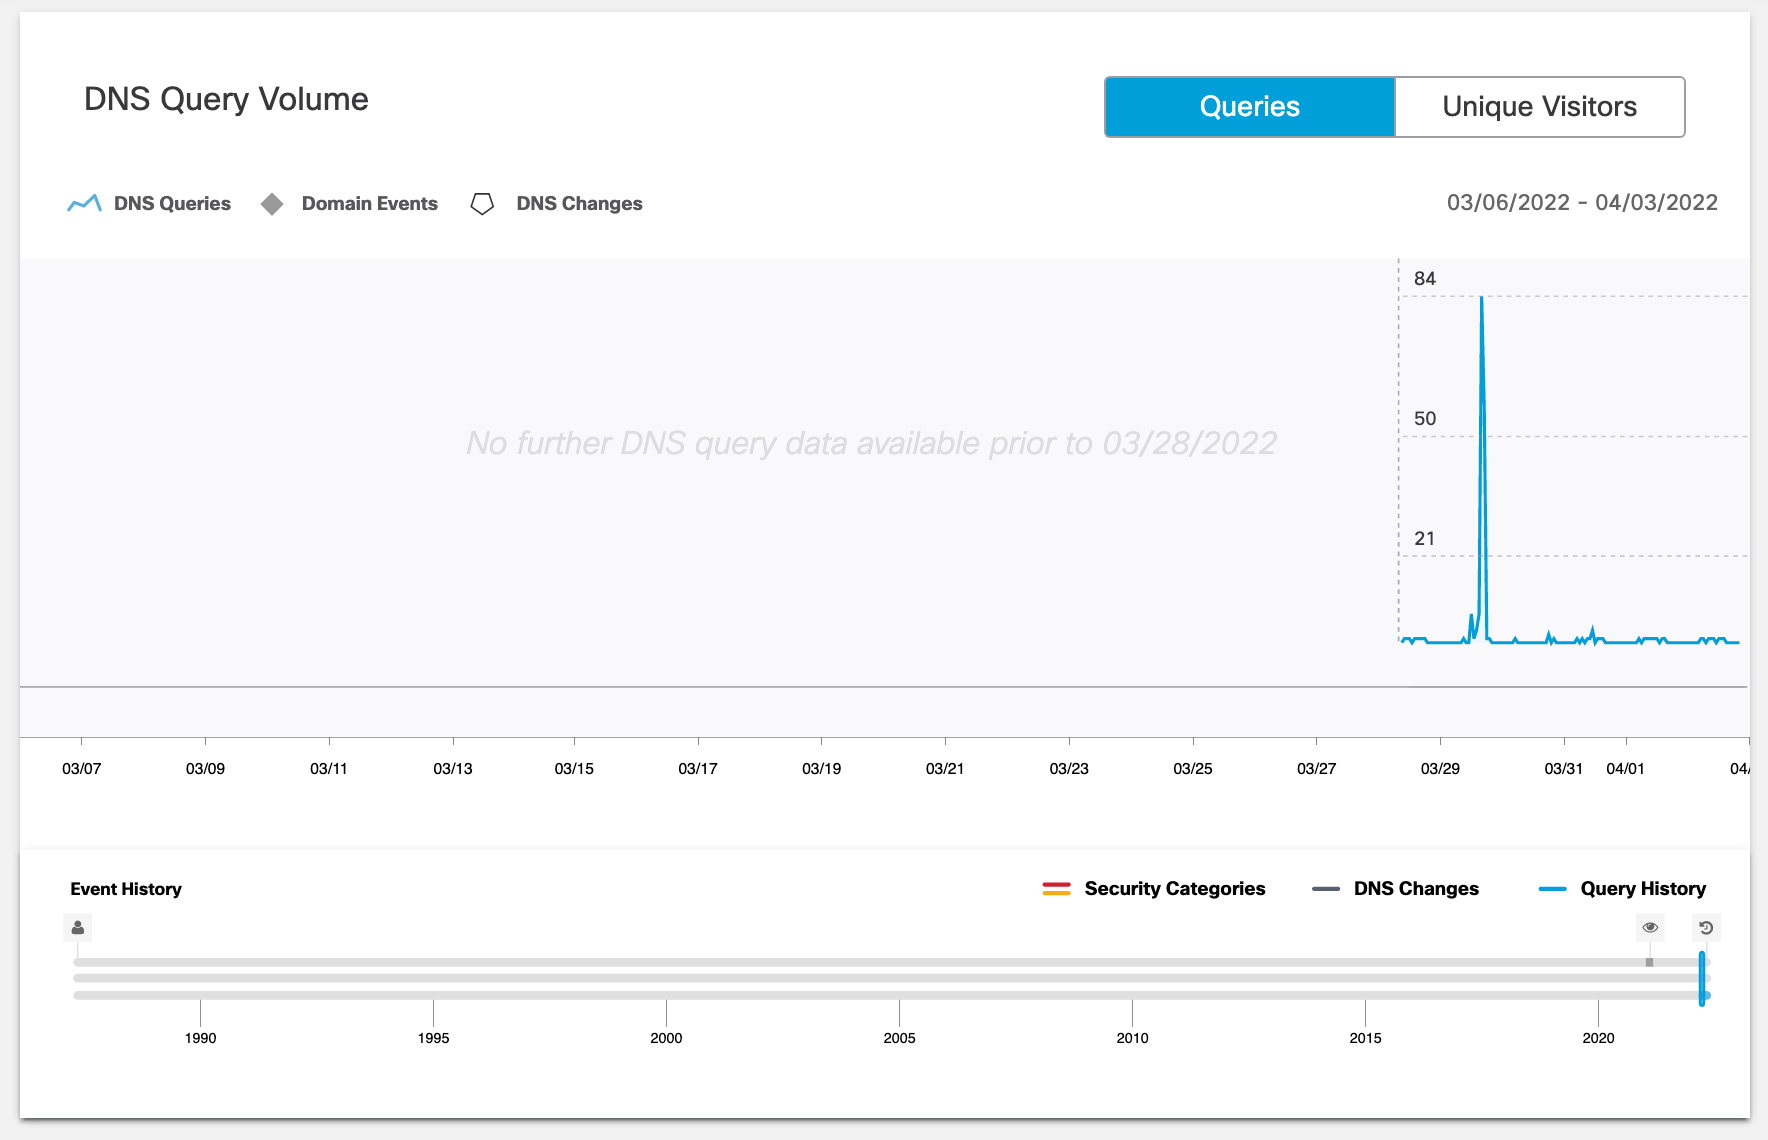
The Passive DNS Timeline displays the DNS query volume, domain events, query history, and DNS changes. You can view the evolution of a domain over time, and view up to four years of DNS changes. For more information, see Passive DNS.
Table of Contents

DNS Query Volume
The DNS Query Volume graph uses three icons:
- Blue Line—The volume of DNS queries over the last 30 days.
- Diamond—Domain events. The icon is colored red for malware, command and control, and phishing. It is colored yellow for other security events.
- Pentagon—DNS changes, such as A record changes. We store DNS changes for up to four years.
Event History
The Event History uses three lines, from top to bottom, to represent the following event types:
- DNS Changes—The top line uses dark grey to show DNS record events, such as A record changes.
- Security Categories—The middle line shows Umbrella security categorization events. Red represents malware, command and control, and phishing. Yellow represents other security events.
- Query History—The bottom line uses blue to show time periods with DNS query history available.
Click on the domain events or DNS changes icons to see details. A panel opens to show events, grouped by resource record type and date. If the view displays more than one event for the selected period, the icon shows the number of available events.

The Event History uses the following icons:
- Person—Domain registration date.

- Eye—Date that the domain was first seen by our resolvers.

- Clock—Domain registration expiration date.

To view more details, mouse over the icon.
Dispute a Security Categorization < Passive DNS Timeline > DNS Resolution
Updated almost 2 years ago
