
Overview Report
The Overview report is the first page you see after logging into Umbrella. It provides an at-a-glance view of your Umbrella deployment's health for the selected period (the default is the last 24 hours).
The Overview report can be filtered by time: the last 24 hours, the previous calendar day (yesterday), the last seven days, and the last month.

Table of Contents
- Message Center
- Deployment Health
- Network Breakdown
- Security Categories
- App Discovery and Control
- Most Security Requests
Message Center
The message center lists notifications of upcoming updates and new features.

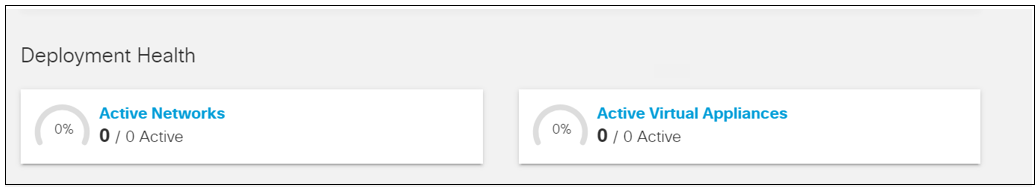
Deployment Health
The deployment health section shows the number of Active Networks, and the number of Active Virtual Appliances.
Network Breakdown
The network breakdown section shows the total number of requests, blocks, and security blocks for the selected period. Security Blocks refers to blocks in any security category.

You have the option to view which requests were blocked for security reasons, or to see all security events.

Clicking on Total Requests, Total Blocks, or Security Blocks in any of the Network Breakdown tabs will bring you to the Activity Search Report with the appropriate filters.

Security Categories
Security Categories shows blocked events for Malware, Phishing, Command and Control, and Cryptomining within the selected time frame.
For more information on these categories, see DNS Security Categories.

To see all security events for these four categories, check the checkbox See All Security Events.

Hovering on a point on the graph will provide the date and number of events or blocks for that date in that category. Click on the point to be redirected to the Activity Search Report filtered by that security category.

App Discovery and Control
The Umbrella Overview page includes three data charts that summarize the last 90 days of discovered apps in your environment. Like the other graphics in the main Umbrella Overview page, the purpose is to provide key information about overall app risk as well as display specific categories and apps that represent a potentially high risk. The first chart shows a summary of discovered cloud apps, risky apps, and apps that are controlled or Blocked in the environment. The middle chart shows the top four relevant and risky app categories and the last chart shows the top four risky apps for further review.

Clicking View All will redirect you to the Apps Grid and clicking View Dashboard will bring you to the App Discovery Report. Clicking on a specific flagged category will bring you to the App Grid filtered by that category. Clicking on a specific app will bring you to that app's details.
Security Requests
The security requests section shows the destinations, identities, and event types that had the most security requests for the selected period. You have the option to see blocked requests for each tab, or check the See All Security Events checkbox to see all events.
Clicking on a specific destination will bring you to the Security Activity Report filtered by that domain and blocked or all responses.

Clicking on a specific identity will bring you to the Security Activity Report filtered by that identity and blocked or all responses.

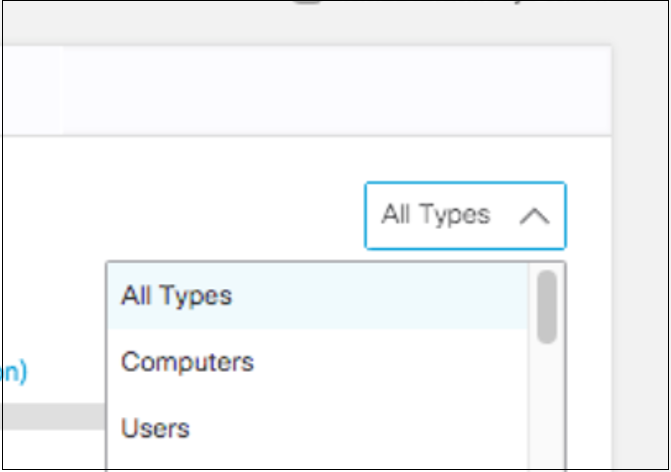
You can also filter the identity tab by types of identities.
Clicking on a specific event type will bring you to the Security Activity Report filtered by that event type and blocked or all responses.

Report Retention < Overview Report > Security Activity Report
Updated 12 months ago