Verify Operation
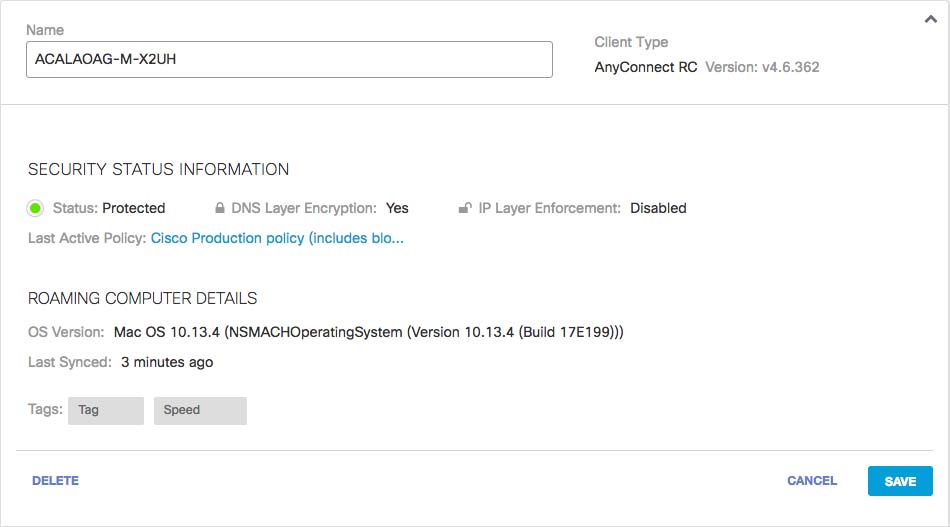
When the indicator is green in the Umbrella dashboard or a blue sphere in the tray icon, it means that the Umbrella roaming client is operating correctly. If the status indicator is not green or the tray icon includes a colored dot, see Status, States, and Functionality for more information.
Verify on Target Computer
By default, the tray icon is installed and visible for both Mac and Windows installations.
Unless you have specifically opted not to install the tray icon through a flag in a command-line/distributed installation, the tray icon is displayed if your installation is successful.
Verify this on the machine you have installed the Umbrella roaming client.
Verify in the Umbrella Dashboard
Through the Umbrella dashboard, there are two ways of verifying the success of your Umbrella roaming client installation.
Admin Audit Log
- In the MSP console, navigate to Customer Management and click a customer name.
The Umbrella dashboard for that customer opens. - In the Umbrella dashboard, navigate to Reporting > Management > Admin Audit Log.
- Under Filters, enter the hostname of the computer in Filter by Identities & Settings and click Run Filter.

- You can also look at a specific timeline and Umbrella roaming client installations will be logged.
Roaming Computers Page
- In the MSP console, navigate to Customer Management and click a customer name.
The Umbrella dashboard for that customer opens. - In the Umbrella dashboard, navigate to Deployments > Core Identities > Roaming Computers.
The hostname of each machine on which you installed the Umbrella roaming client, as well as its status and policy information, is listed. You can also search for the hostname just like the Admin Audit Log.

- Click a name to expand it.

Automated Deployment < Verify Operation > Status, States, and Functionality
Updated about 3 years ago
