Security Summary Report
The Security Summary report includes an overview that shows traffic and security events for all of your organizations during the selected time period. Navigate to Centralized Reports > Security Summary to access the report.

Understand the Security Summary Report
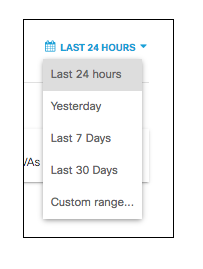
The Security Summary Report data can be displayed for a specific time period with the last 24 hours as the default. You can choose to display data for the previous day (Yesterday), Last 7 Days, Last 30 Days, or a Custom range. Custom Range for the Security Summary Report is only in increments of 30 days.
When you search for a specific organization, this overview information updates so that it is specific to the organization.
Organizations
The Organizations tab provides a view into the DNS requests across the orgs in your MSP and the blocked requests based on security category. You can search for a specific org to display only that org's data, or view all at once. Clicking on any individual org will bring you to that org's dashboard.
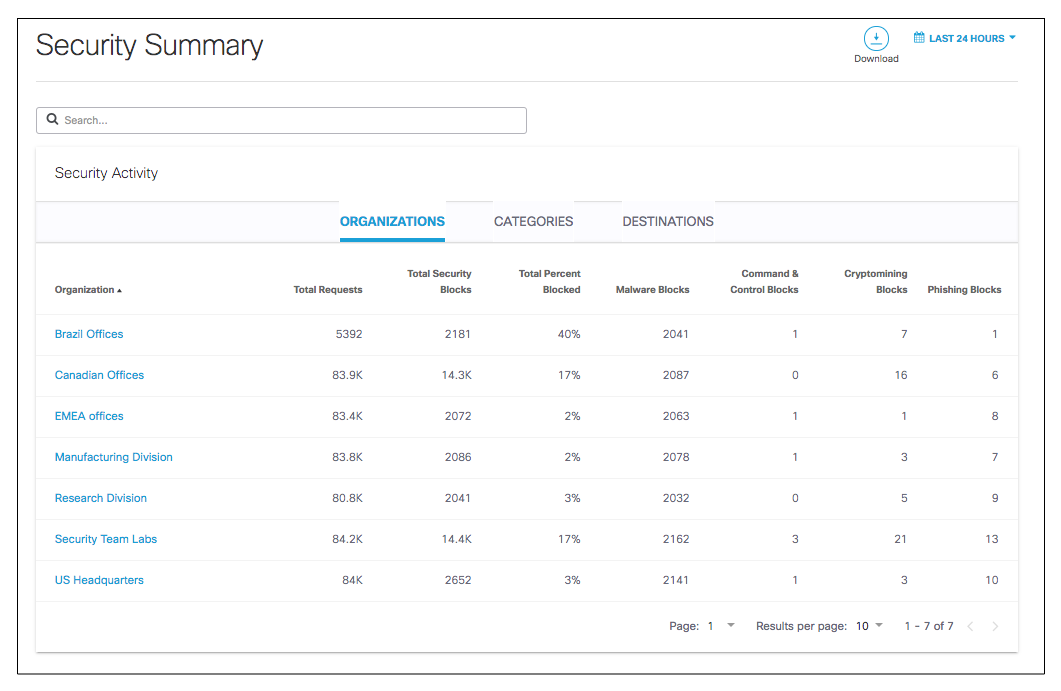
Each org displays data in the following columns:
- Total Requests—The total number of DNS requests made for each org.
- Total Security Blocks—The total number DNS requests blocked due to security risk.
- Total Percent Blocked—The percentage of all DNS requests which are blocked.
- Malware Blocks—The number of DNS queries blocked because the domains are believed to be distributing malware.
- Command and Control Blocks—The number of DNS requests blocked because the domains are believed to be command and control servers used by infected machines to join a botnet.
- Cryptomining Blocks—The number of DNS requests blocked due to crypto-mining attempts.
- Phishing Blocks—The number of DNS requests blocked due to phishing attempts.
Categories
The Categories tab presents data on DNS requests and the categories the type of query falls into.
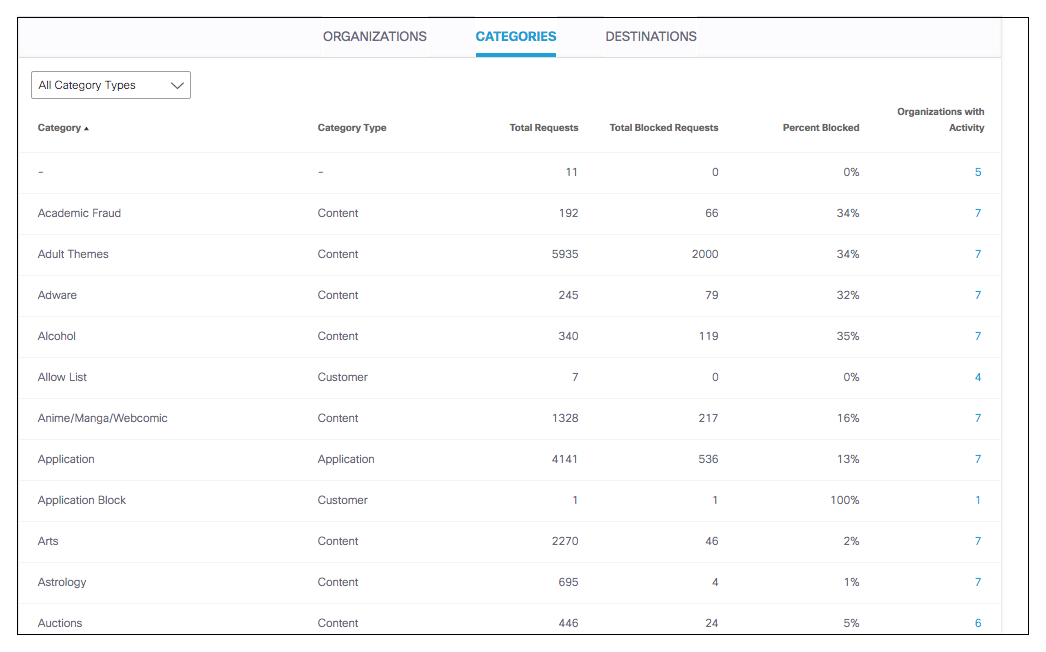
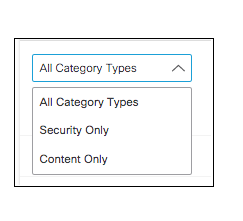
You can filter the categories by Security, Content or display all:
You can also search for specific categories to display requests for that specific category.
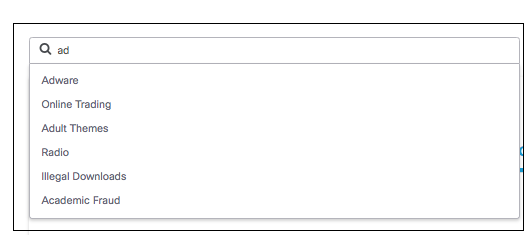
- Category—The categories where DNS requests are made.
- Category Type—The type of category (such as Content, Security, or Application) the category falls into.
- Total Requests—the total number of DNS requests made in this category.
- Total Blocked Requests—The total number of requests in this category that were blocked.
- Percent Blocked—The percentage of all requests made in this category that were blocked.
- Organizations with Activity—The number of orgs in the MSP with activity in this category. Clicking on the number will show al ist of the orgs with this activity and the number of requests per org.
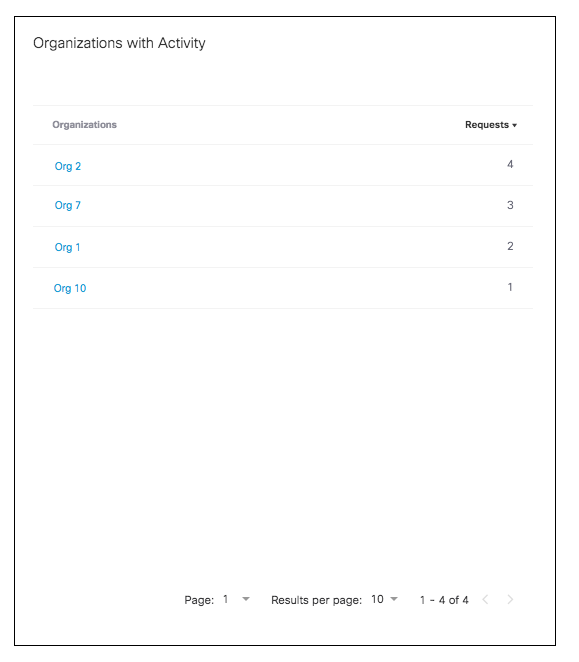
Clicking on an individual org will bring you to that org's dashboard.
Destinations
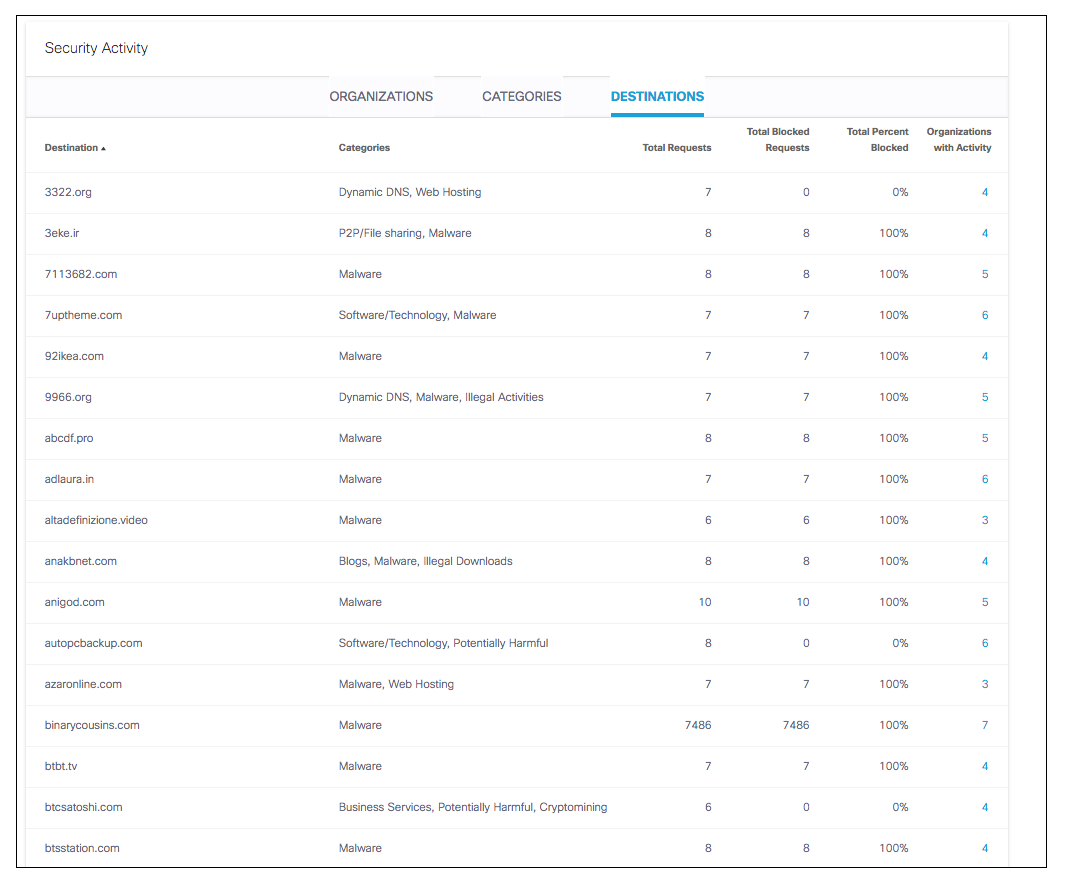
- Destinations—The top 100 destinations across the orgs in your MSP.
- Categories—The content and security categories the DNS requests made to these destinations fall into.
- Total Requests—The total number of DNS requests made to the destination.
- Total Blocked Requests—The number of requests that are blocked of the total requests made to this destination.
- Total Percent Blocked—The percentage of all requests made to this destination that are blocked.
- Organizations with Activity—The number of orgs in the MSP with activity to this destination. Clicking on the number will show al ist of the orgs with this activity and the number of requests per org.
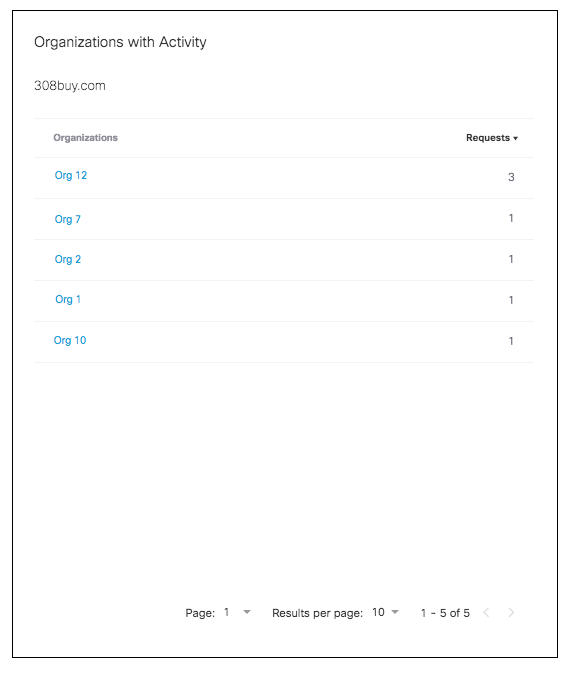
Clicking on an individual org will bring you to that org's dashboard.
Download the Security Summary Report
To download the Security Summary Report as a CSV choose the time frame you wish the report to reflect. Then click Download.
Deployment Status Report < Security Summary Report
Updated almost 4 years ago
