Deployment Status Report
The Deployment Status report provides you with an overview of the total number of networks, Umbrella roaming clients, and VAs for your customer base. Navigate to Centralized Reports > Deployment Status to access the report.

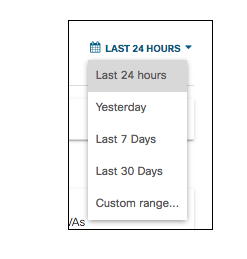
The Deployment Status Report data can be displayed for a specific time period with the last 24 hours as the default. You can choose to display data for the previous day (Yesterday), Last 7 Days, Last 30 Days, or a Custom range.

Deployment and Health Statuses
The deployment and health statuses display the overall networks, Umbrella roaming clients (RCs), and virtual appliances (VAs) deployed across your customer's environments.
Organization Health
These three diagrams show what percentage of your MSP's organizations have Networks, RCs and VAs deployed.
Total Deployment Health
These three diagrams display what percentage of all Networks, RCs and VAs across these organizations are currently active.

Organizations
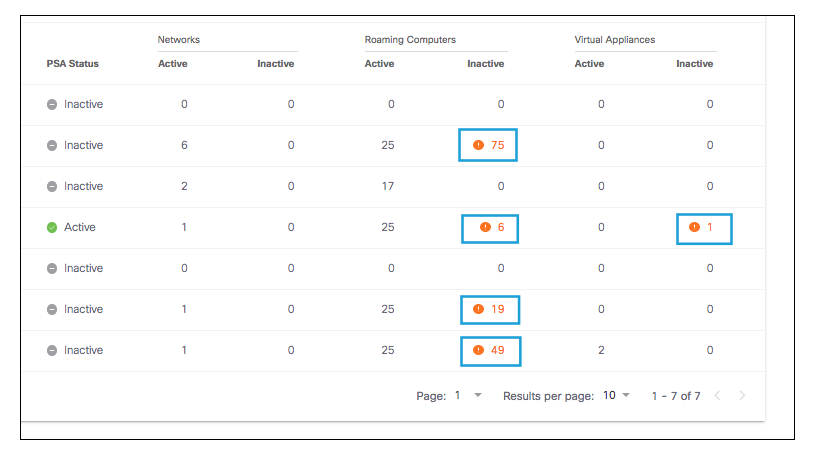
The Organizations chart displays the active and inactive networks, roaming computers and VAs across the orgs in your MSP. The organization column can be adjusted to display the orgs in alphabetical order and each column can be arranged in ascending or descending order. The chart also displays the PSA (Personal Services Automation) statuses for each org. You can search for a specific organization to update the overview information to be specific to that org.

For each organization, any inactive or unhealthy items are highlighted in orange and can be selected to pivot you to the org's Umbrella dashboard deployment section with a focused view on exactly which components are inactive. The purpose of this view is to provide insight into what deployments need attention perhaps due to configuration issues.
Overview Report < Deployment Status Report > Security Summary Report
Updated almost 6 years ago
