Overview Report
The Overview report gives you a quick snapshot of some key features for all your customers: Notifications, Deployment and Health Statuses and Activity Summaries.
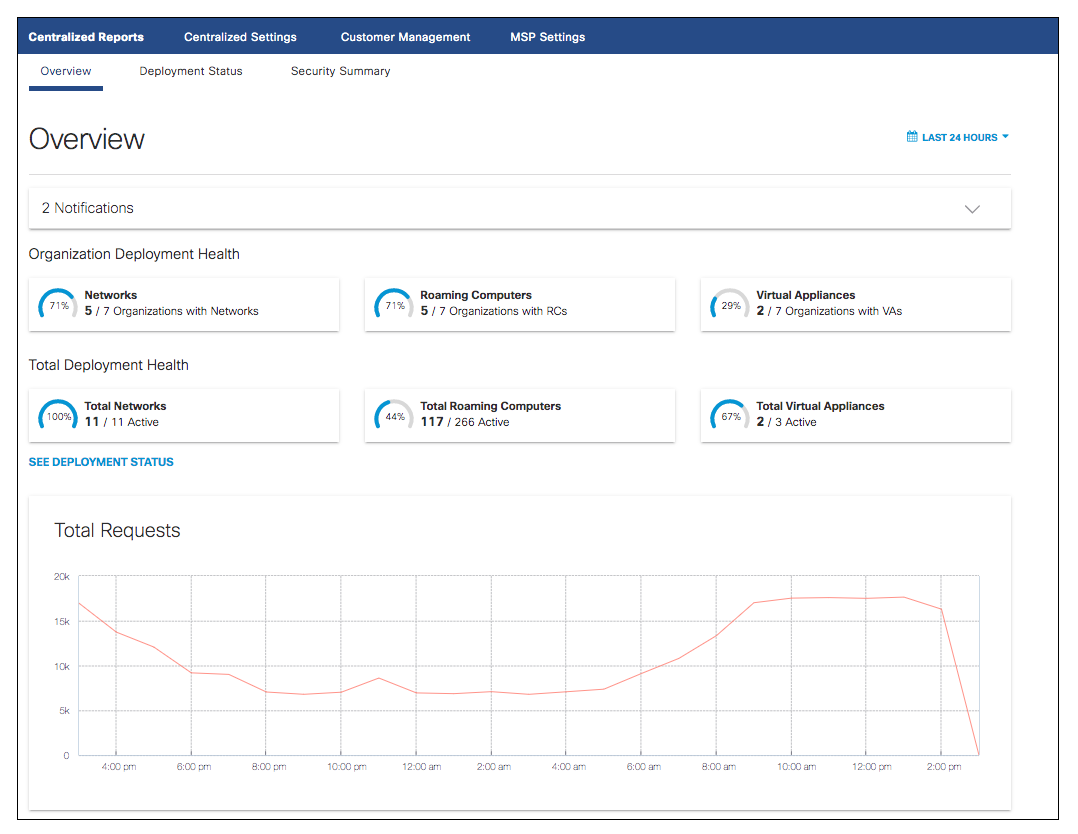
To access the Overview Report, navigate to Centralized Reports > Overview.
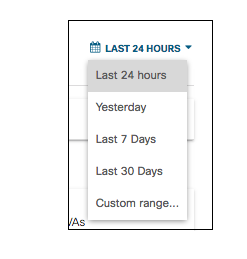
The Overview Report data can be displayed for a specific time period with the last 24 hours as the default. You can choose to display data for the previous day (Yesterday), Last 7 Days, Last 30 Days, or a Custom range.
Notifications
The top section of the Overview Report displays any notifications relevant to your organizations. The caret in the upper right will toggle the Notifications drop-down. Clicking the red "x" to the right of any notification will dismiss it from the drop-down.

Deployment and Health Statuses
The deployment and health statuses display the overall networks, Umbrella roaming clients (RCs), and virtual appliances (VAs) deployed across your customer's environments.
Organization Health
These three diagrams show what percentage of your MSP's organizations have Networks, RCs and VAs deployed.

Total Deployment Health
These three diagrams display what percentage of all Networks, RCs and VAs across these organizations are currently active.

Click See Deployment Status Report to view further details in the Deployment Status Report.
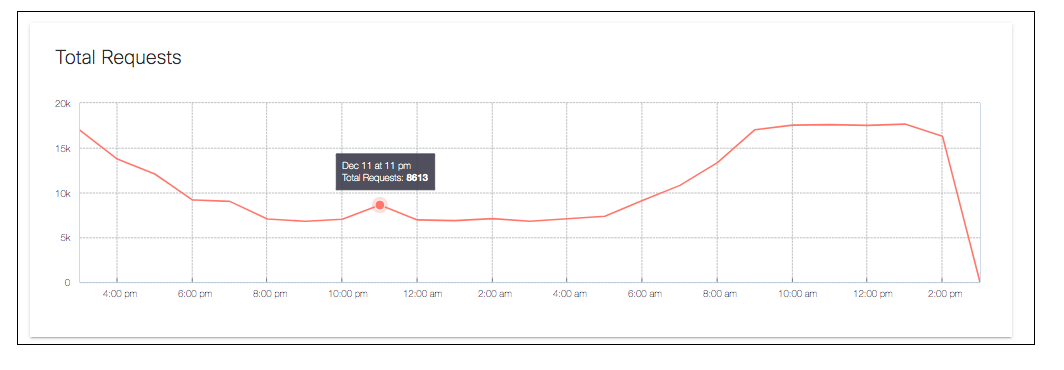
Total Requests
This chart displays all the DNS requests across all the orgs within your MSP within the selected time frame. Hovering on a point on the graph will show the total requests at that date and time.
Security Activity
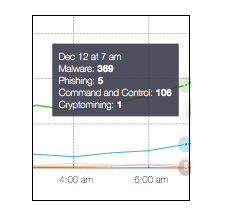
The Security Activity graph displays DNS requests for certain security categories within the selected time frame. Clicking on any of the categories' colored icons will toggle their data visible or not visible in the graph. Viewing the requests for each of these categories enables you to view where security risks may be prevalent in categories with high numbers of DNS requests.
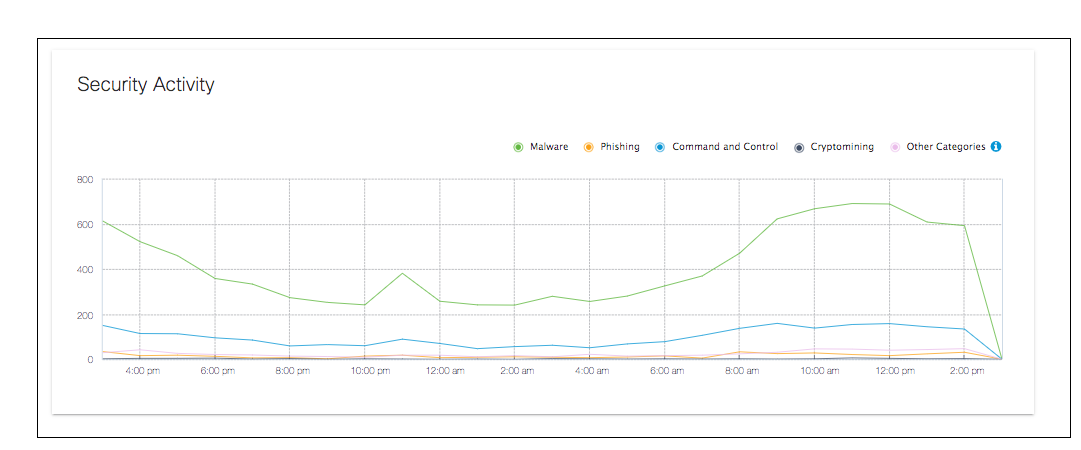
Hovering on a specific date and time in the graph will display the requests for each category at that specific date and time.
Manage Centralized Reports < Overview Report > Deployment Status Report
Updated about 4 years ago
