Top Categories Report
The Top Categories report is a list of the top security and content categories by DNS and firewall requests for your Umbrella organization over the selected period.
Not all features described here are available to all Umbrella packages. For more information, see Determine Your Current Package. If you encounter a feature described here that you do not have access to, contact your sales representative for more information. See also, Cisco Umbrella for Government Packages.
Table of Contents
- Prerequisites
- Top Categories Quick View
- View the Top Categories Report
- View Category in Other Reports
Prerequisites
- A minimum of Read Only access to the Umbrella dashboard. See Manage User Roles.
Top Categories Quick View
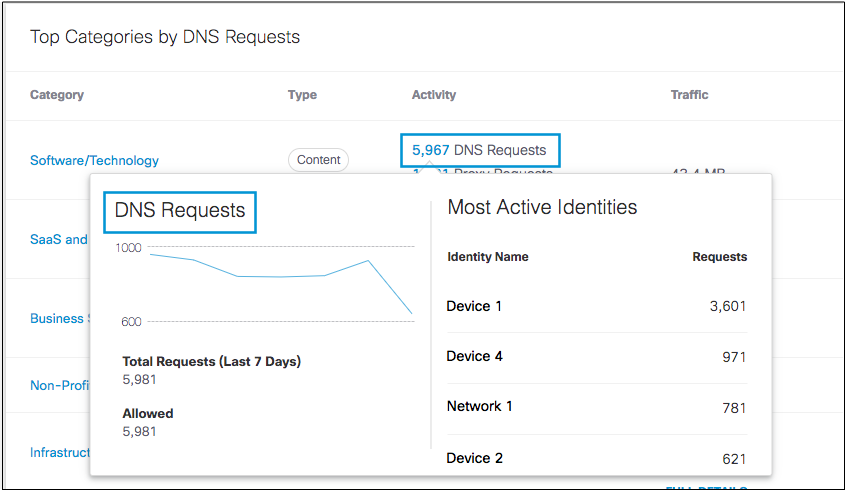
The quick view for Top Categories displays the most active identities and their respective requests for each individual category.
- Choose a time frame within which to view the quick view details.
You can see details for the last 24 hours, the previous calendar day (yesterday), the last 7 days, the last 30 days, or a custom range within the last 30 days.

- Click on the number of requests (DNS or Proxy) in the Activity column of the category you wish to examine.
A modal appears with a graph displaying the total requests of that traffic type over the selected time period and the total number of allowed requests. The most active identities with requests in this category are also displayed.
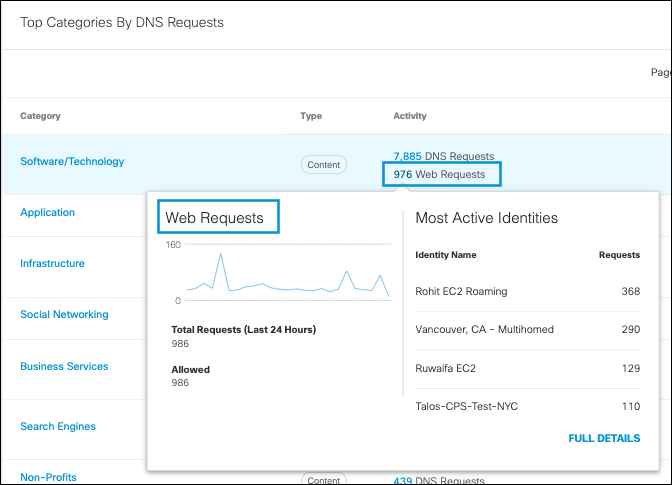
- Optionally, click on Full Details to redirect to the Category Details for this category.
View the Top Categories Report
- Navigate to Reporting > Additional Reports > Top Categories.
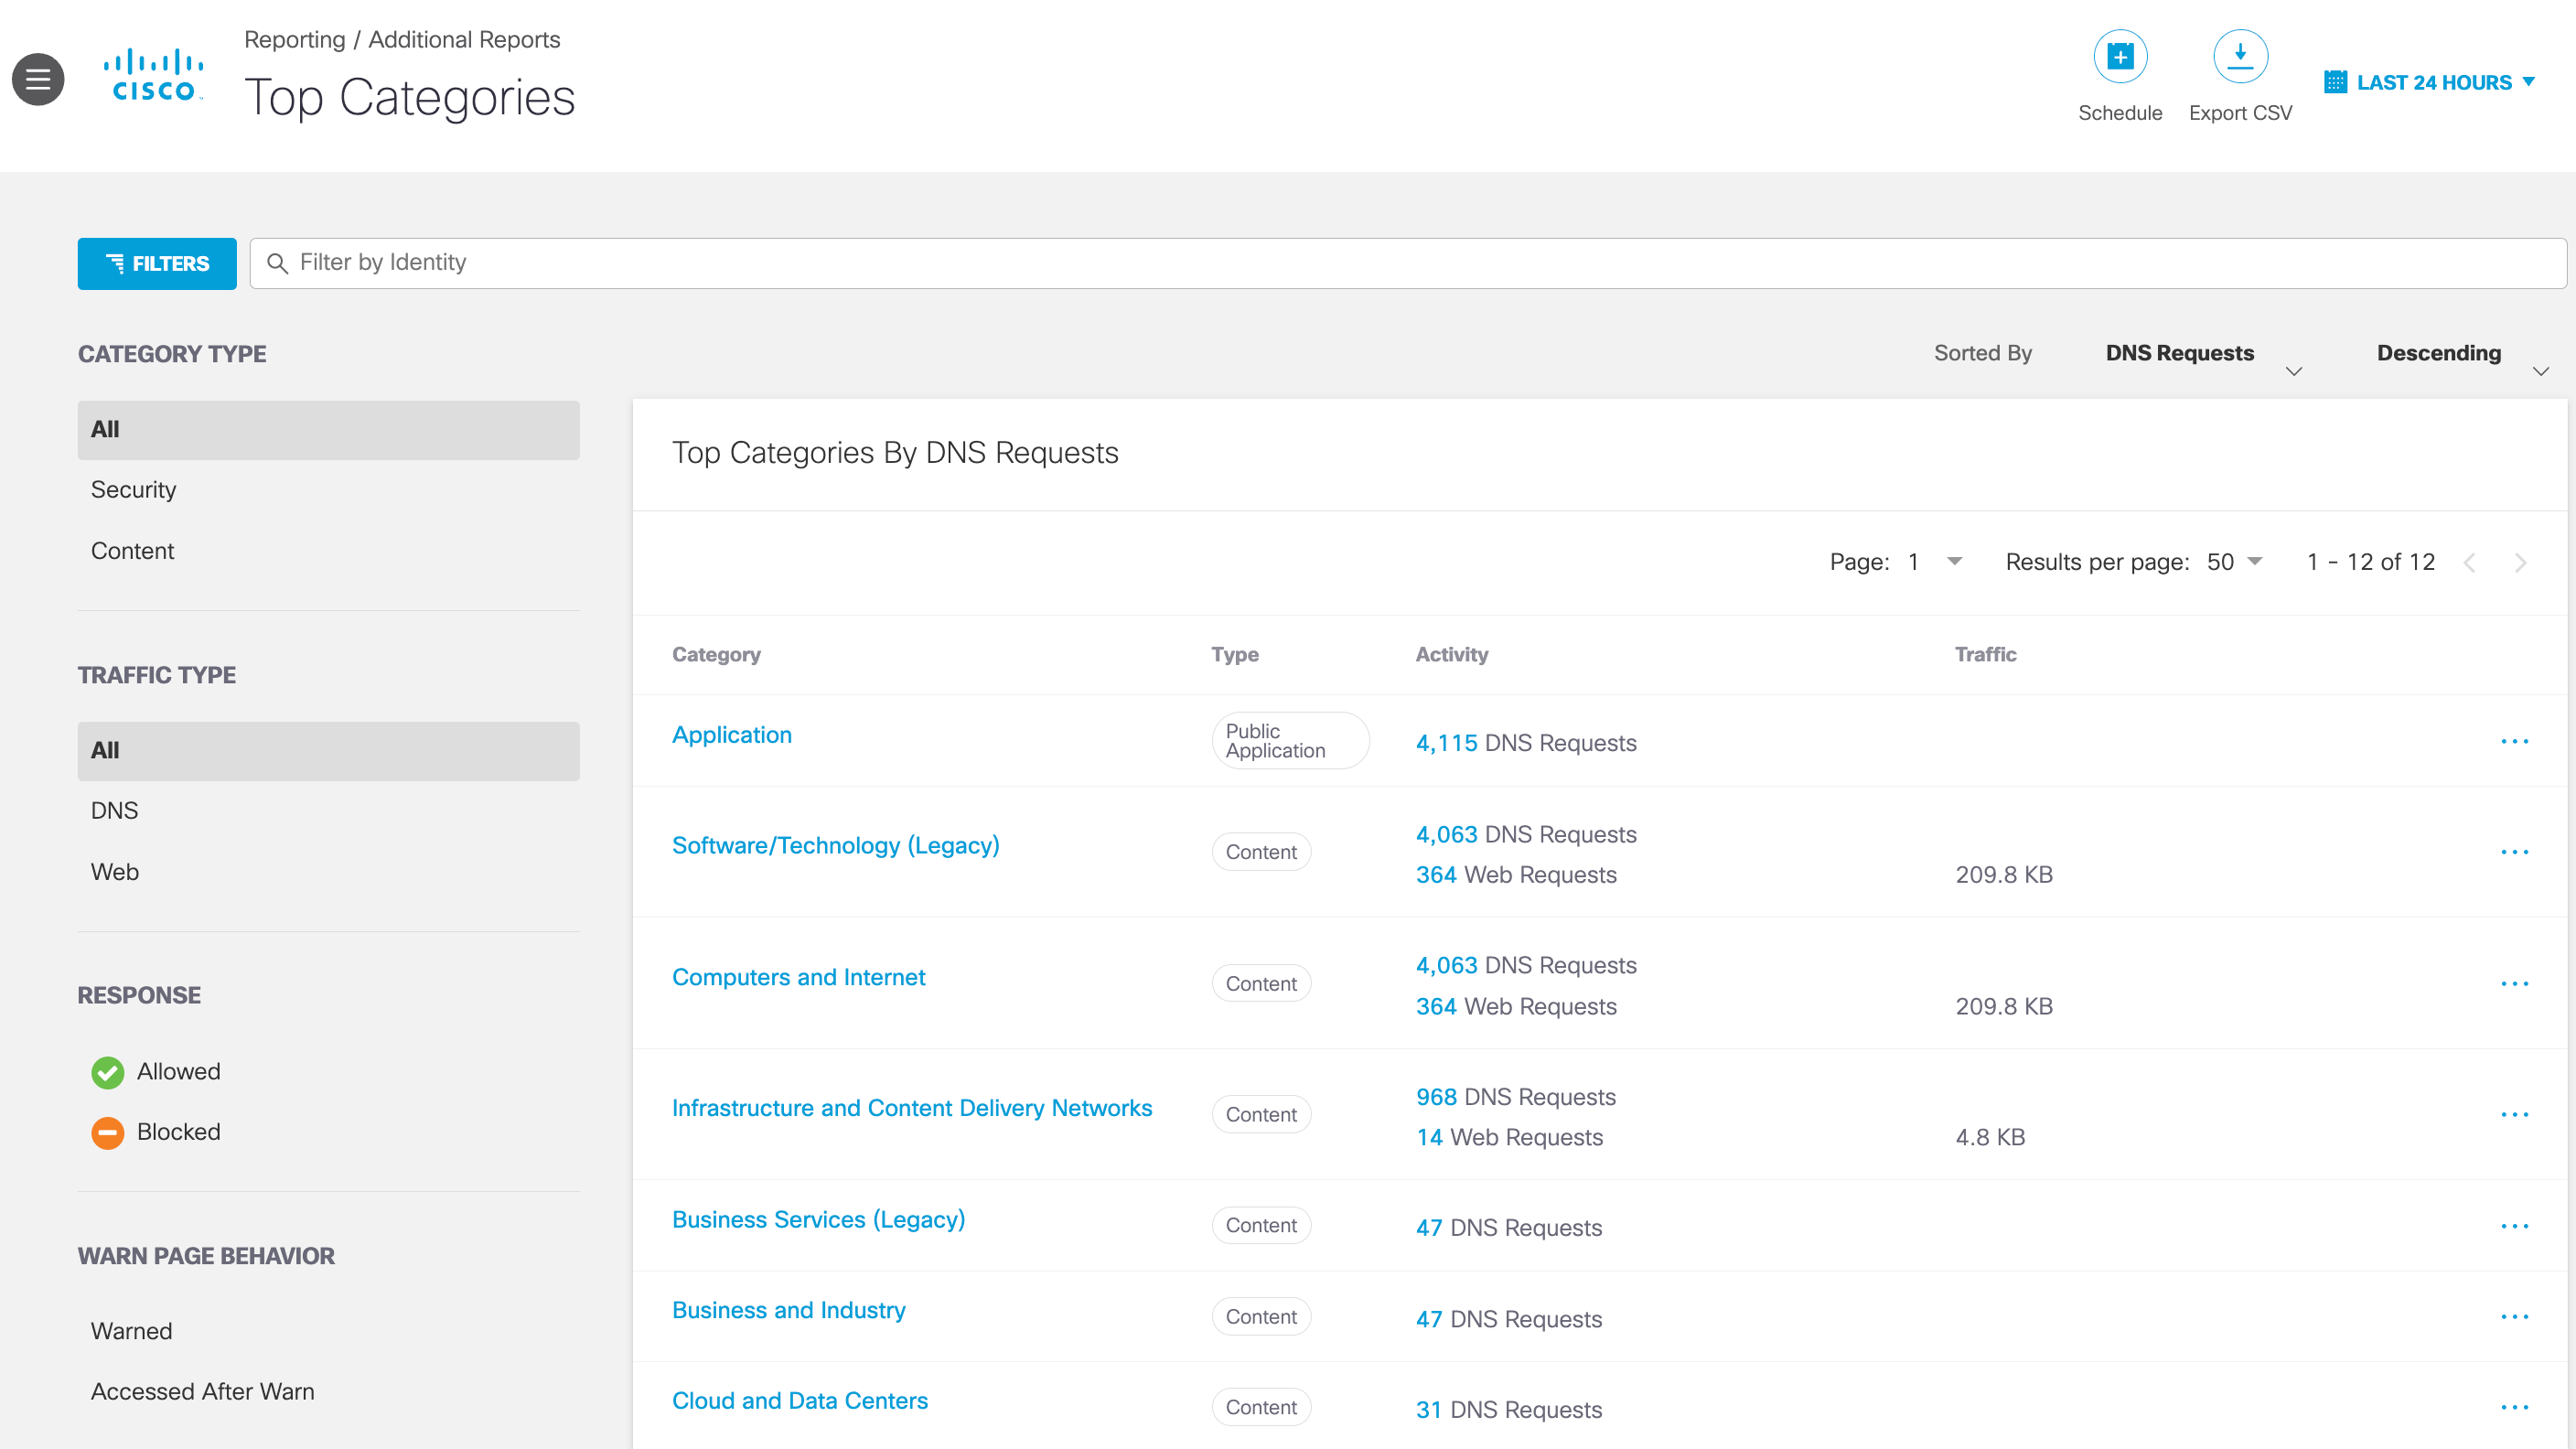
Report Fields
- Category—The category, such as Malware, Business Services, Phishing, and so on.
To see a full list of categories, see Manage Security Settings, DNS Content Categories, Web Content Categories, and Application Categories. Clicking a category name redirects you to the Category Details section. - Type—The type of category: security, content, or application.
- Traffic—The total bandwidth of proxy requests uploaded and downloaded for this category.
- Activity—The number of requests for the category for the selected period. Clicking the number of requests reveals more information:
- the total requests for the selected period
- which of the requests were blocked and which were allowed
- the most active identities (the identities that have requested the category the most)
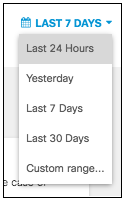
- Choose a time frame within which to view the result. You can view the report for the last 24 hours, the previous day (yesterday), last week, the last 30 days, or a custom range within the last 30 days.
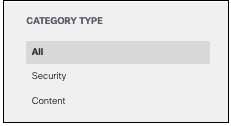
- Filter the top categories by category type.
You can view Security categories, Content categories, or both. By default, All is selected, so that both security and content categories are shown.
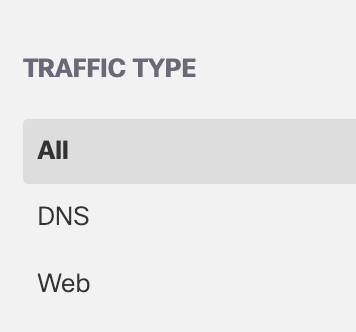
- Filter top categories by traffic type.
You can filter by DNS requests only, Web requests only, or all request types.
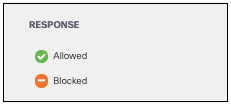
- Filter top categories by response type.
You can view categories from requests that were Allowed, Blocked, or both. By default, neither is selected, so all responses are shown.
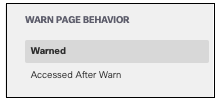
- Filter requests that were warned or accessed after a warn.
- Choose identity types to filter results and click Apply.
By default, no identity types are selected, so all identity types are shown.
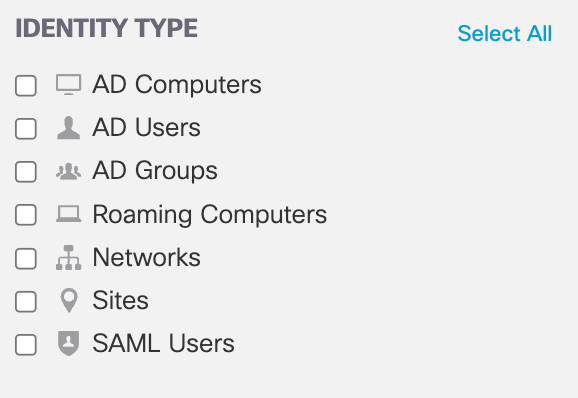
You also have the option to search by identity if you know the identity name.

- Choose how to sort the top category results.
Sort by Traffic
- DNS Requests—Show DNS requests first.
- Web Requests—Show Web requests first.
- Web Traffic—Show Web traffic first.
Ascending or Descending Order
- Descending—Show the results in descending order. By default, descending is selected.
- Ascending—Show the results in ascending order.
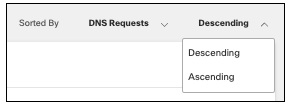
Once you have chosen all filters and sorting options, the report will reflect the appropriate results.
View Category in Other Reports
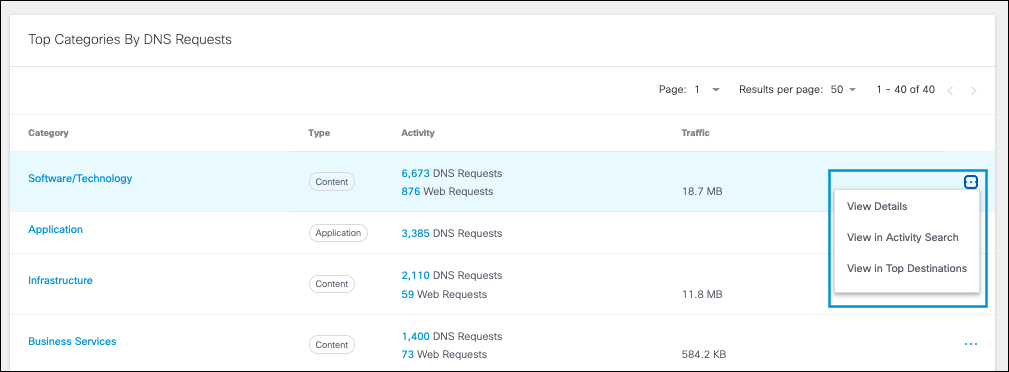
Viewing the category in other reports provides you with insights into how your organization accesses a destination category and what activities are involved. In the Top Categories report, each category can be explored further by accessing the View Menu. Clicking this menu (the "...") reveals three options:
- View Details— Redirects you to that category's details.
- View in Activity Search—Redirects you to the Activity Search report filtered by that category.
- View in Top Destinations—Redirects you to the Top Destinations report filtered by this category.
Destination Details < Top Categories Report > Category Details
Updated about 1 year ago
