
Incidents Page Overview
Table of Contents
The Incidents page separates into four panels summarizing the total incidents produced within the platform by different criteria. The first two smaller panels will only populate incidents with a status of New or In Progress.
Policies with the Most Incidents
This panel lists the top five policies with the most incidents triggered. choosing any of the policies will redirect you to the last panel, Incident Search, filtered by that policy and the statuses of New and In Progress.
Users with the Most Incidents
This panel displays the top five users with the most incidents within the last week. Choosing any username will redirect you to the last panel, Incident Search, filtered by the user, the last seven days, and the statuses of New and In Progress.
Incident Rates
The rightmost panel on the Incidents page details the rate at which incidents are produced or resolved for a week, three days, or 24 hours. For Incident Rate, the graph divides into incident severity, to provide a picture of the type of incidents that come into the environment. (Severity is a configuration criterion designated during policy management). Hovering the cursor on any part of the graph will populate a key that provides the number of incidents for each severity level. Because the incidents depicted represent the rate of incoming new incidents, only incidents with a status of New or In Progress are calculated.
The graph for Resolution Rate illustrates how many incidents were resolved within the chosen time frame. The incidents are once again divided by severity level to show which type of incident is resolved the most over a given time. Unlike Incident Rate, this graph looks at only incidents with a status of Dismissed or Resolved.
Incident Search
The bottommost graphic on the Incidents page allows you to narrow down incidents by several criteria. The Shortcuts drop-down provides quick access to New incidents in the last 7 days, In Progress incidents in the last 7 days, and New and In Progress incidents in the last 30 days. You can search incidents by policy, current status, detection date, the platform, severity, and owner of the file that triggered the incident. When you filter the incidents by any of these criteria, the bottom of the page displays the number of incidents that fit the criteria.

Default Filter—If you wish to save your filters in the Search you can create a default filter. Select the filters you wish to search by and the option to Save as a default shortcut appears. To access the default, select the drop-down menu Shortcuts and select My default view.

Bulk Actions—In the Bulk Actions drop-down, you have the option to either Edit the Severity/Status of several incidents or to Export a list of incidents. For the selected incidents, you can also update Incident Notes in bulk in the Edit Severity / Status window.
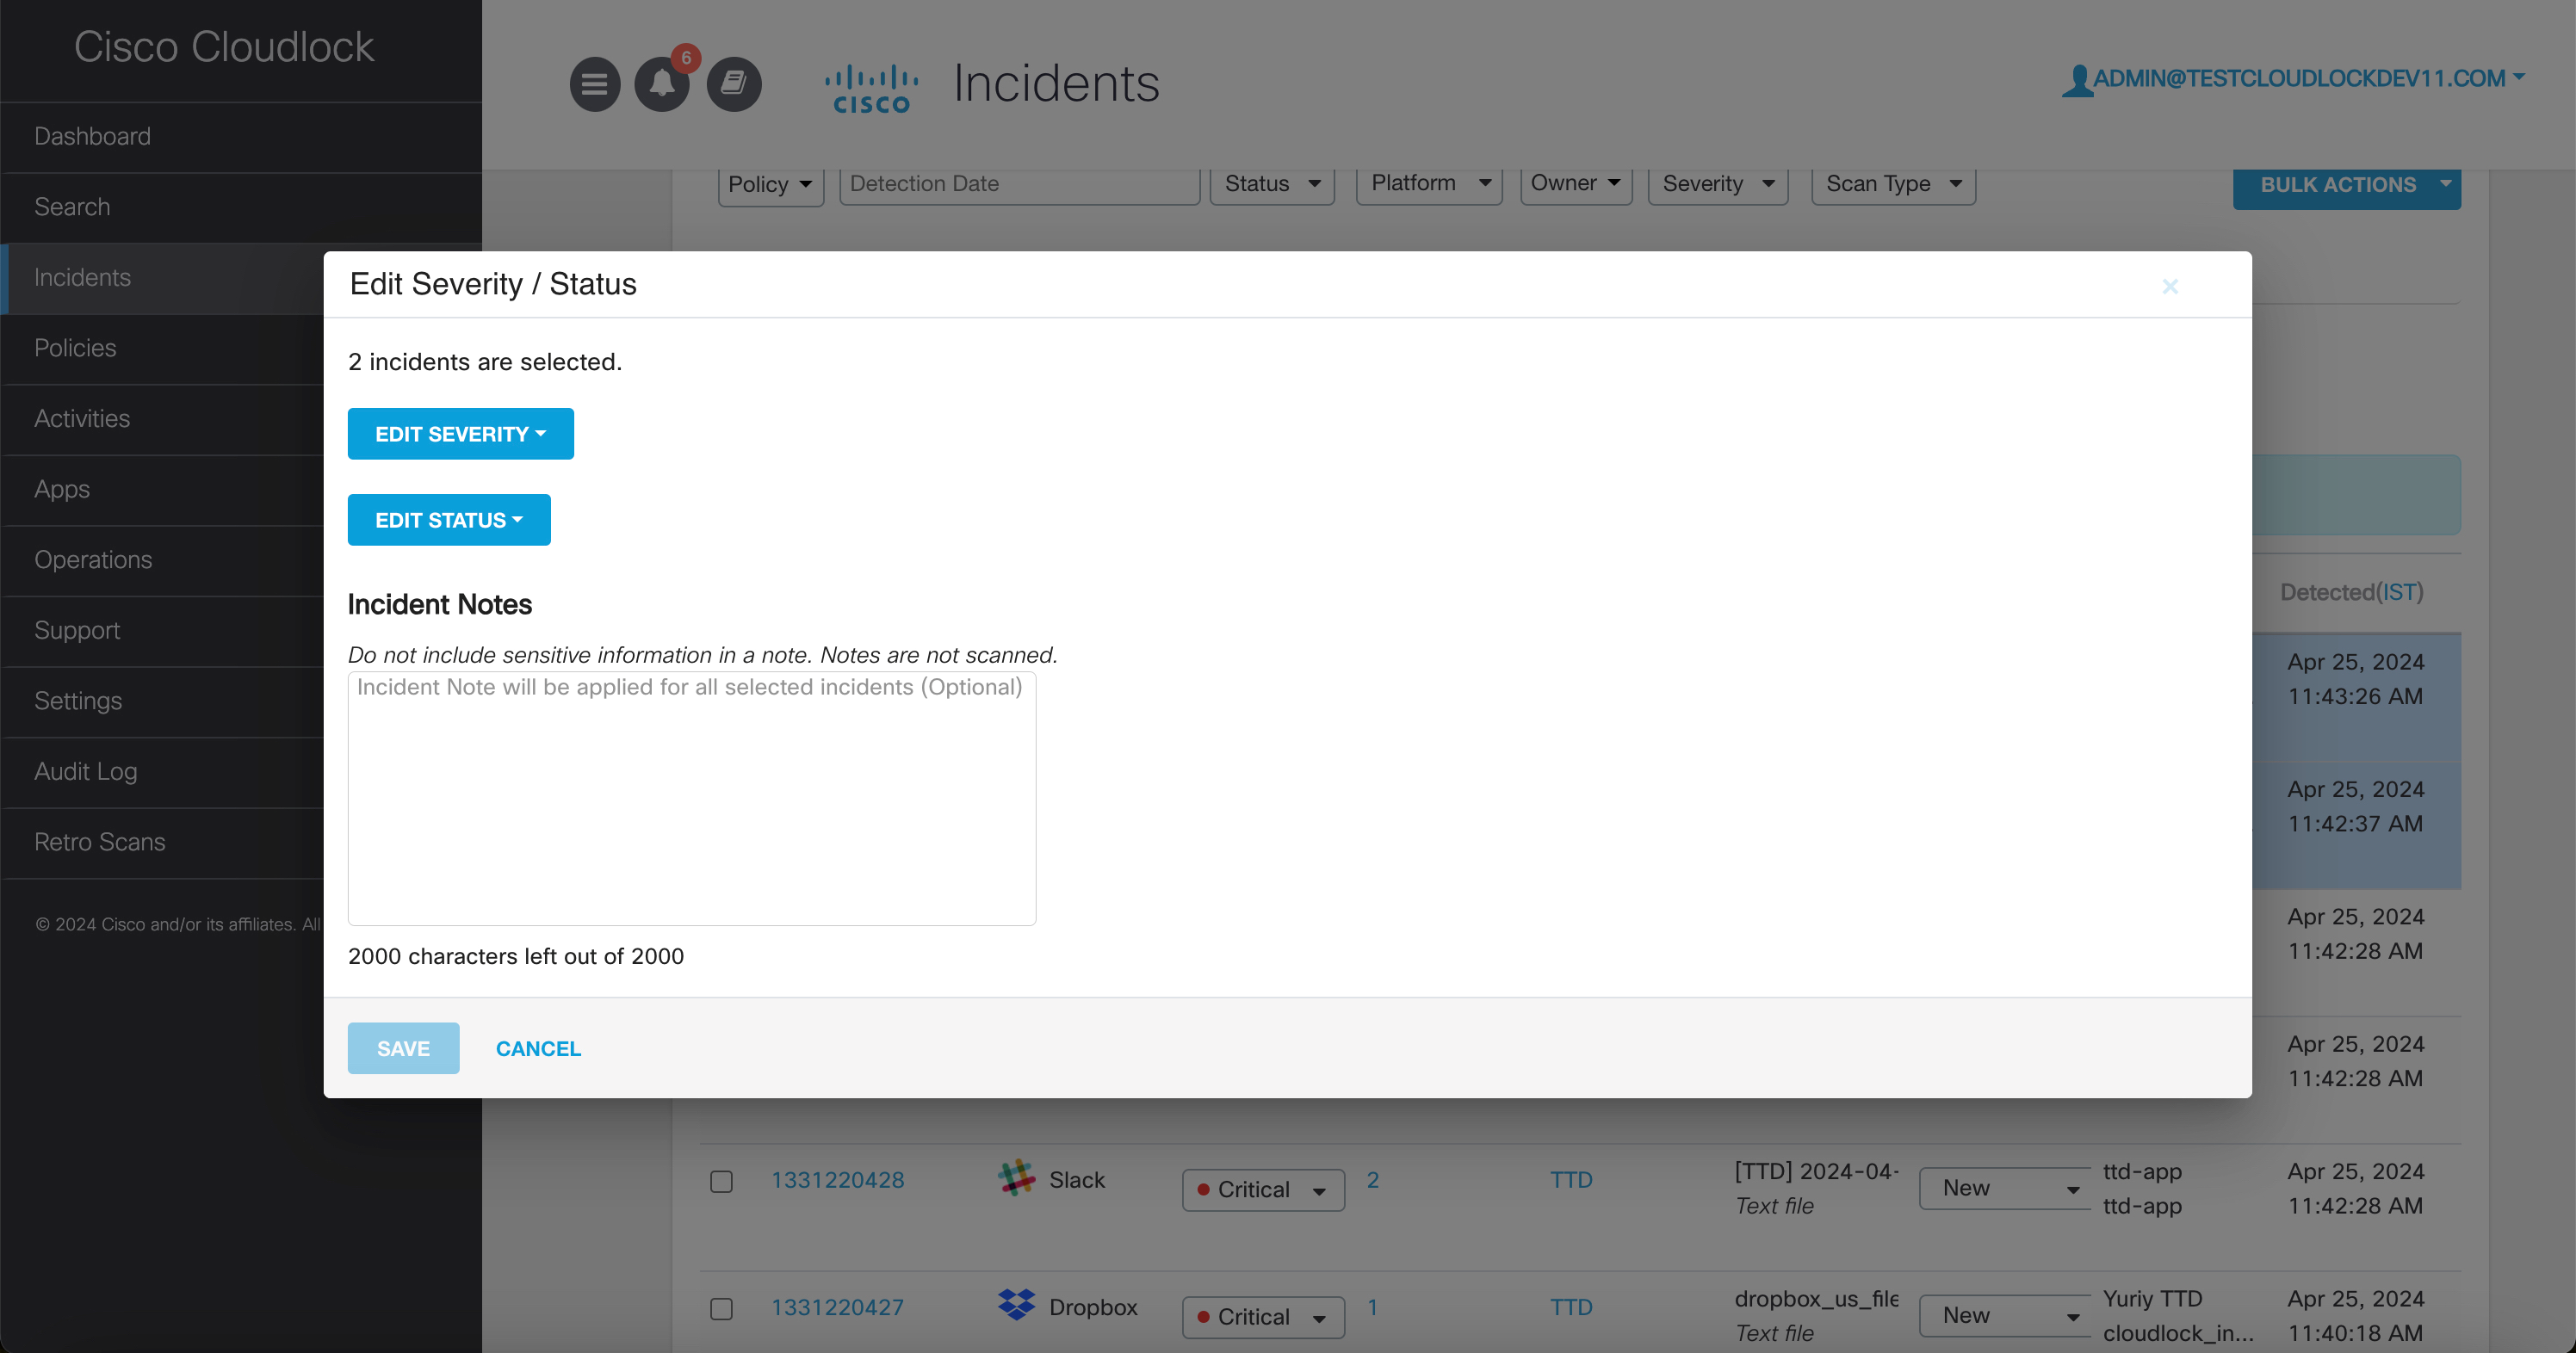
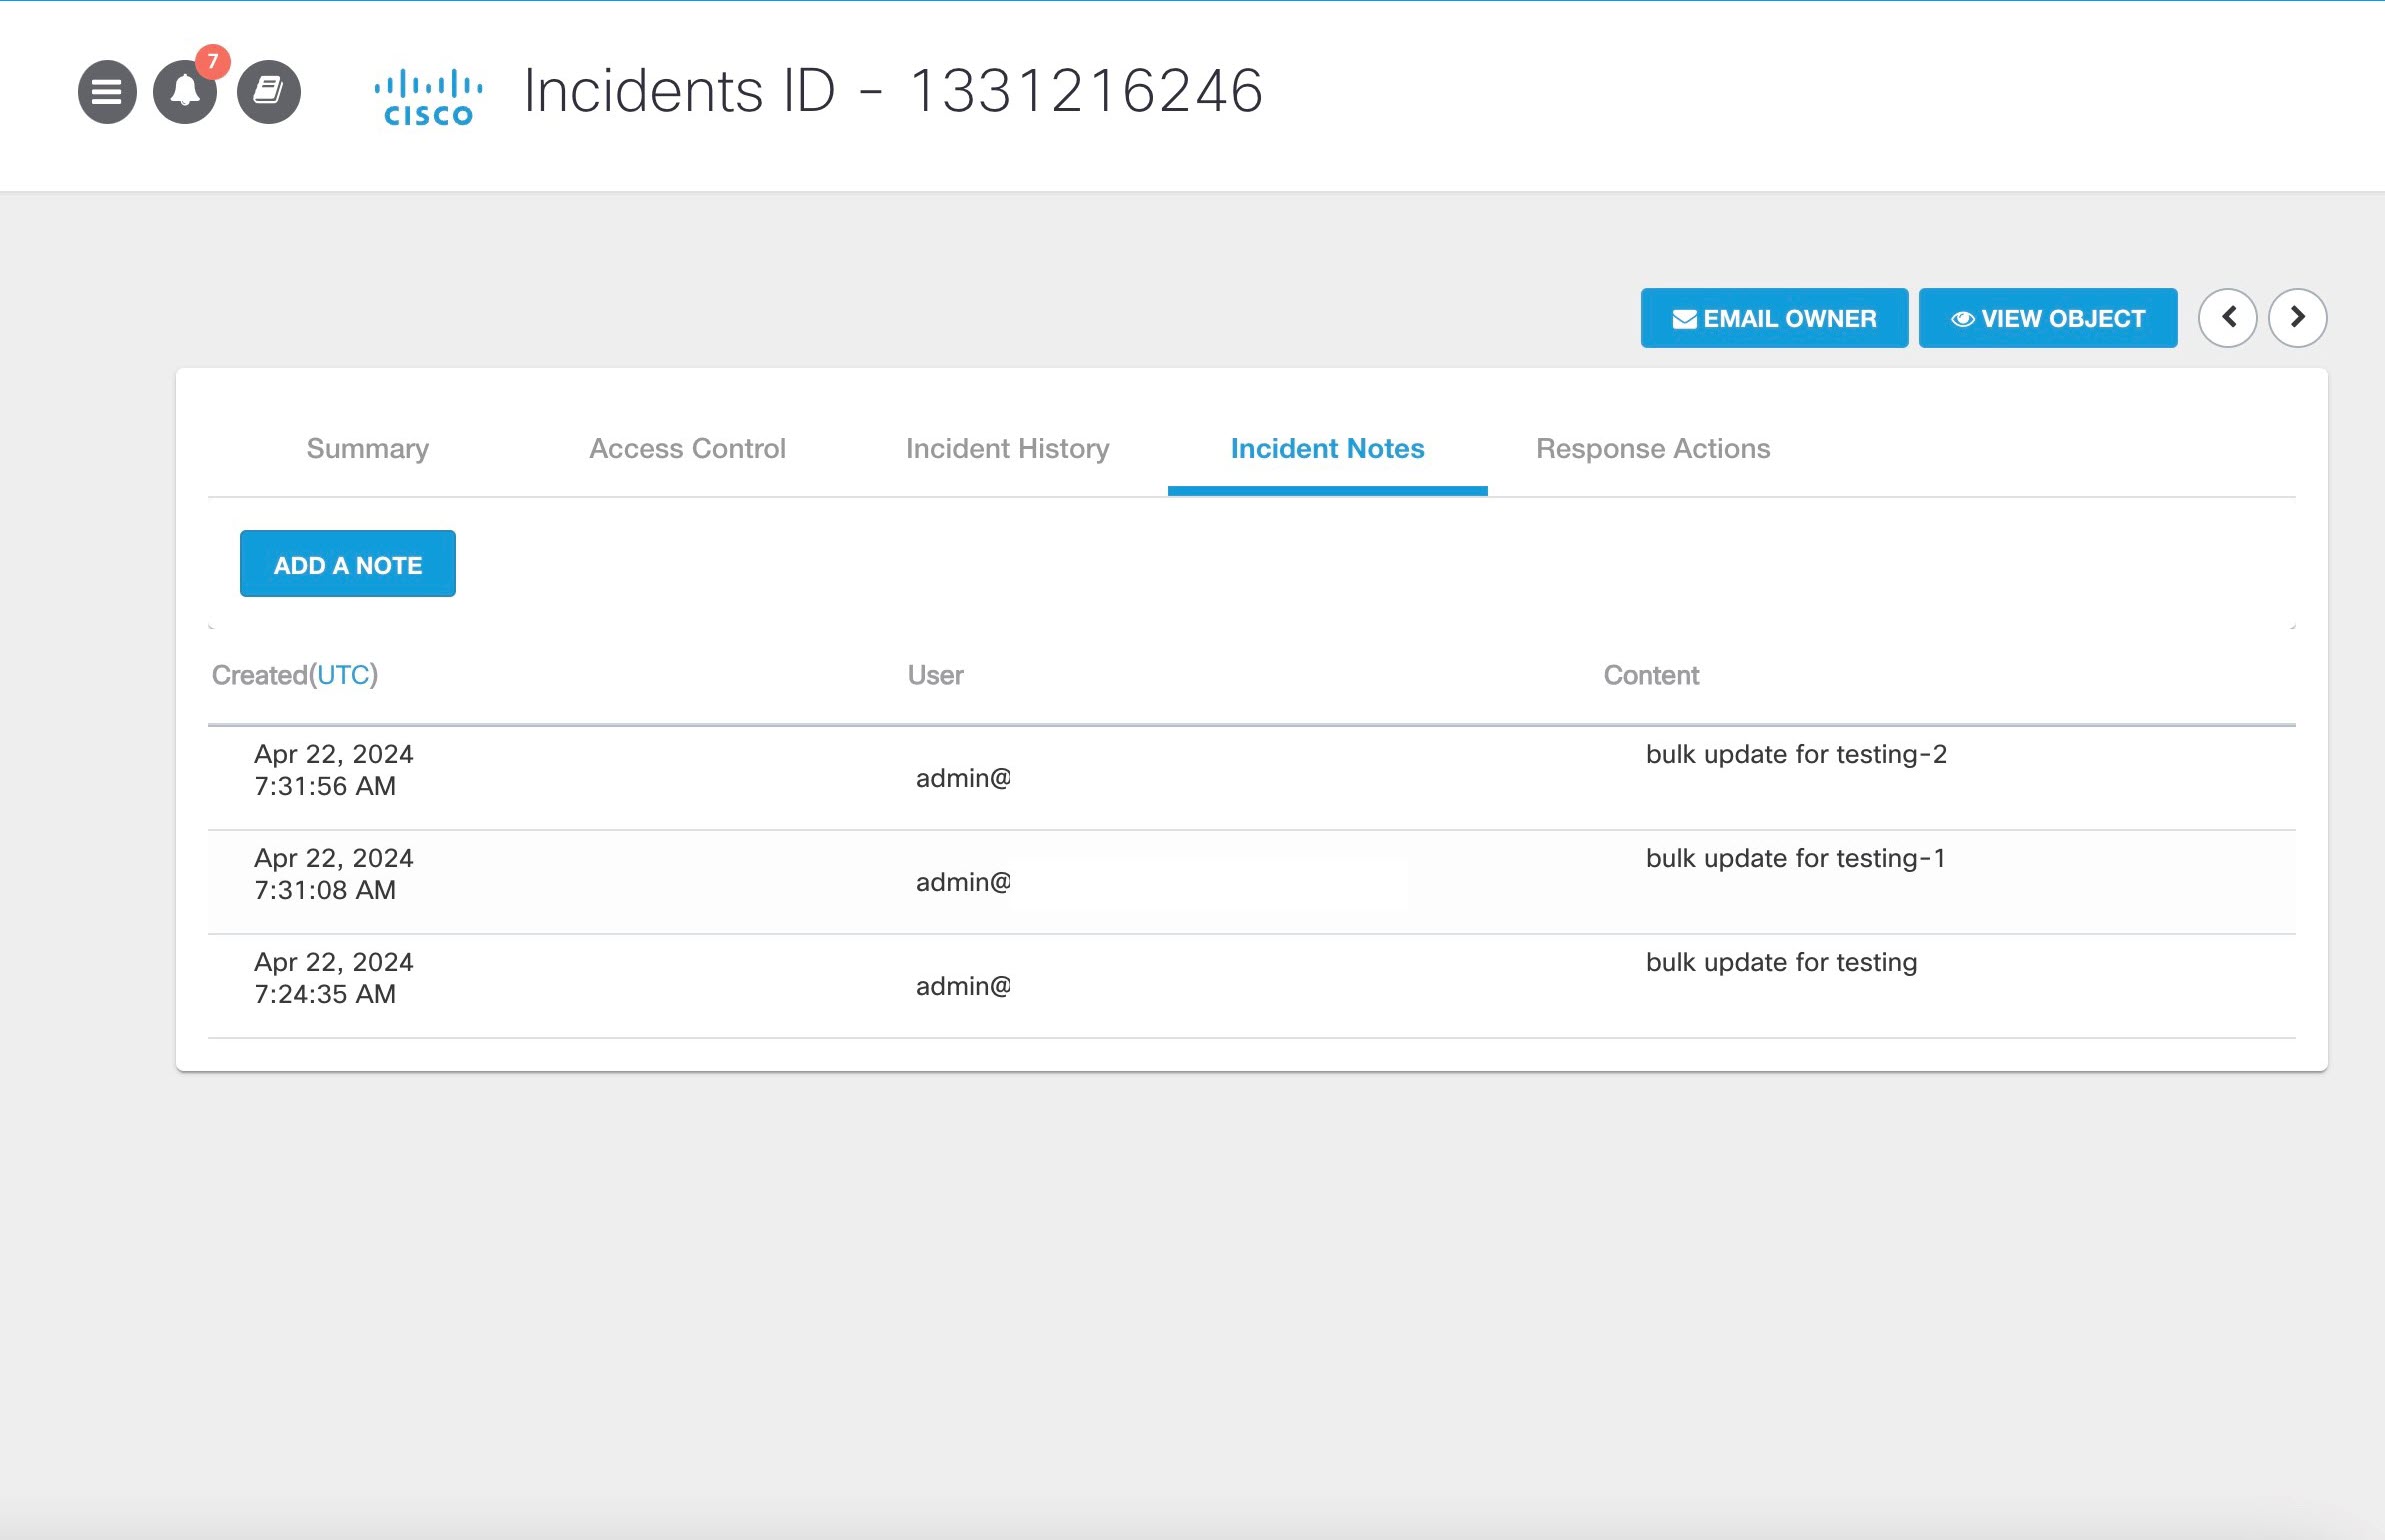
The Incident Notes added here get added to the individual incidents. You can see the notes in the Incident Notes tab of the individual incidents.
Editing the status is a quick way to Resolve many incidents that may be false positives and need no further attention. Exporting the selected incidents provides a link to download two .csv files: one containing the incidents and data about the incidents, and the other containing the matches for these incidents.
Updated over 1 year ago