
Log Formats and Versioning
Zipped CSV log files are available for download from either Cisco's managed S3 bucket or your own S3 bucket. Unzipping and opening these files displays multiple columns of information extracted from your Umbrella logs. There are additional fields that are exposed in these logs that are not normally shown through Umbrella's reports. For more information on reporting, see Get Started with Reports.
Note: Logs are not always chronological and will not always be in the specific time bucket based on the timestamp of the log event.
Table of Contents
- Prerequisites
- File Name Format
- Find Your Log Schema Version
- View Your Headers
- Log File Fields
- Estimate the Size of Your Logs
- Estimate the Size of an Exported Report
Prerequisites
- Full admin access to the Umbrella dashboard. See Manage User Roles.
- Configure logging to an Amazon S3 bucket. See Enable Logging to Your Own S3 Bucket or Enable Logging to a Cisco-managed S3 Bucket.
File Name Format
Logs are uploaded in ten-minute intervals from the Umbrella log queue to the S3 bucket. Within the first two hours after a completed configuration, you should receive your first log upload to your S3 bucket. To check to see if everything is working, the Last Sync time in the Umbrella dashboard should update and logs should begin to appear in your S3 bucket. The logs will appear in a GZIP format with the following file name format. The files will also be sorted into date-stamped folders.
DNS traffic
dnslogs/<year>-<month>-<day>/<year>-<month>-<day>-<hour>-<minute>.csv.gz
Proxied traffic (the intelligent proxy)
proxylogs/<year>-<month>-<day>/<year>-<month>-<day>-<hour>-<minute>.csv.gz
Admin Audit
auditlogs/<year>-<month>-<day>/<year>-<month>-<day>-<hour>-<minute>.csv.gz
Subfolders
Logs are uploaded to S3 buckets in the appropriate subfolder with the following naming format.
<subfolder>/<YYYY>-<MM>-<DD>/<YYYY>-<MM>-<DD>-<hh>-<mm>-<xxxx>.csv.gz
Umbrella names a log subfolder () with one of the following folder names:
dnslogsproxylogsauditlogs
The segment of the log GZIP file name is a random string of four alphanumeric characters, which prevents duplicate file names from being overwritten.
Example: dnslogs/2019-01-01/2019-01-01-00-00-e4e1.csv.gz
Find Your Log Schema Version
Umbrella provides multiple versions of log schemas. The availability of various Umbrella log schemas depends on your Umbrella subscription and the type of S3 bucket that you configure. Once your system is configured to log to an Amazon S3 bucket you can view the log schema version in use.
Log Schema Versions
- v1—For customers who have configured their own S3 bucket before November 2017. This version has a single sub-folder in the bucket and contains only DNS traffic logs.
- v2—For customers who have configured their own S3 bucket after November 2017, or are using a Cisco-managed bucket. This version is inclusive of everything in version 1, and adds two new log types: Proxy traffic logs and IP traffic logs. Each log type has its own sub-folder.
- v3— The same as version 2, but adds two new fields: Most Granular Identity Type and Identity Types for DNS logs.
- v4—The same as version 3, but adds the Blocked Categories field for DNS and Proxy logs.
- v5—The same as version 4, but adds three new fields: all Identities, all Identity Types, and Request Method for Proxy logs.
- v6—The same as version 5 with these additional fields to Proxy logs: Certificate Errors, Destination Lists IDs, DLP Status, File Name, Rule ID, and Ruleset ID.
- v7—The same as version 6, but adds the DLP file label field.
- v8—The same as version 7, but adds the Isolate Action, File Action, and Warn Status fields to the Proxy log.
- v9—The same fields as version 8, but the v9 log format adds fields to the Proxy logs.
- v10—The same fields as version 9, but the v10 log format adds the following fields to the DNS logs: Rule ID, Destination Countries, Organization ID.
- v11—The same fields as version 10, but the v11 log format adds two new fields : Application Entity Name, and Application Entity Category to Web logs.
- v12—The same fields as version 11.
- v13—The same fields as version 12.
Version 1 Bucket Recreation
To upgrade from v1 to a higher version of the Umbrella log format, you must remove your existing S3 bucket, disable the integration, and then recreate a new bucket. For all other versions, you can upgrade from the Log Management screen of the Umbrella dashboard by clicking Upgrade.
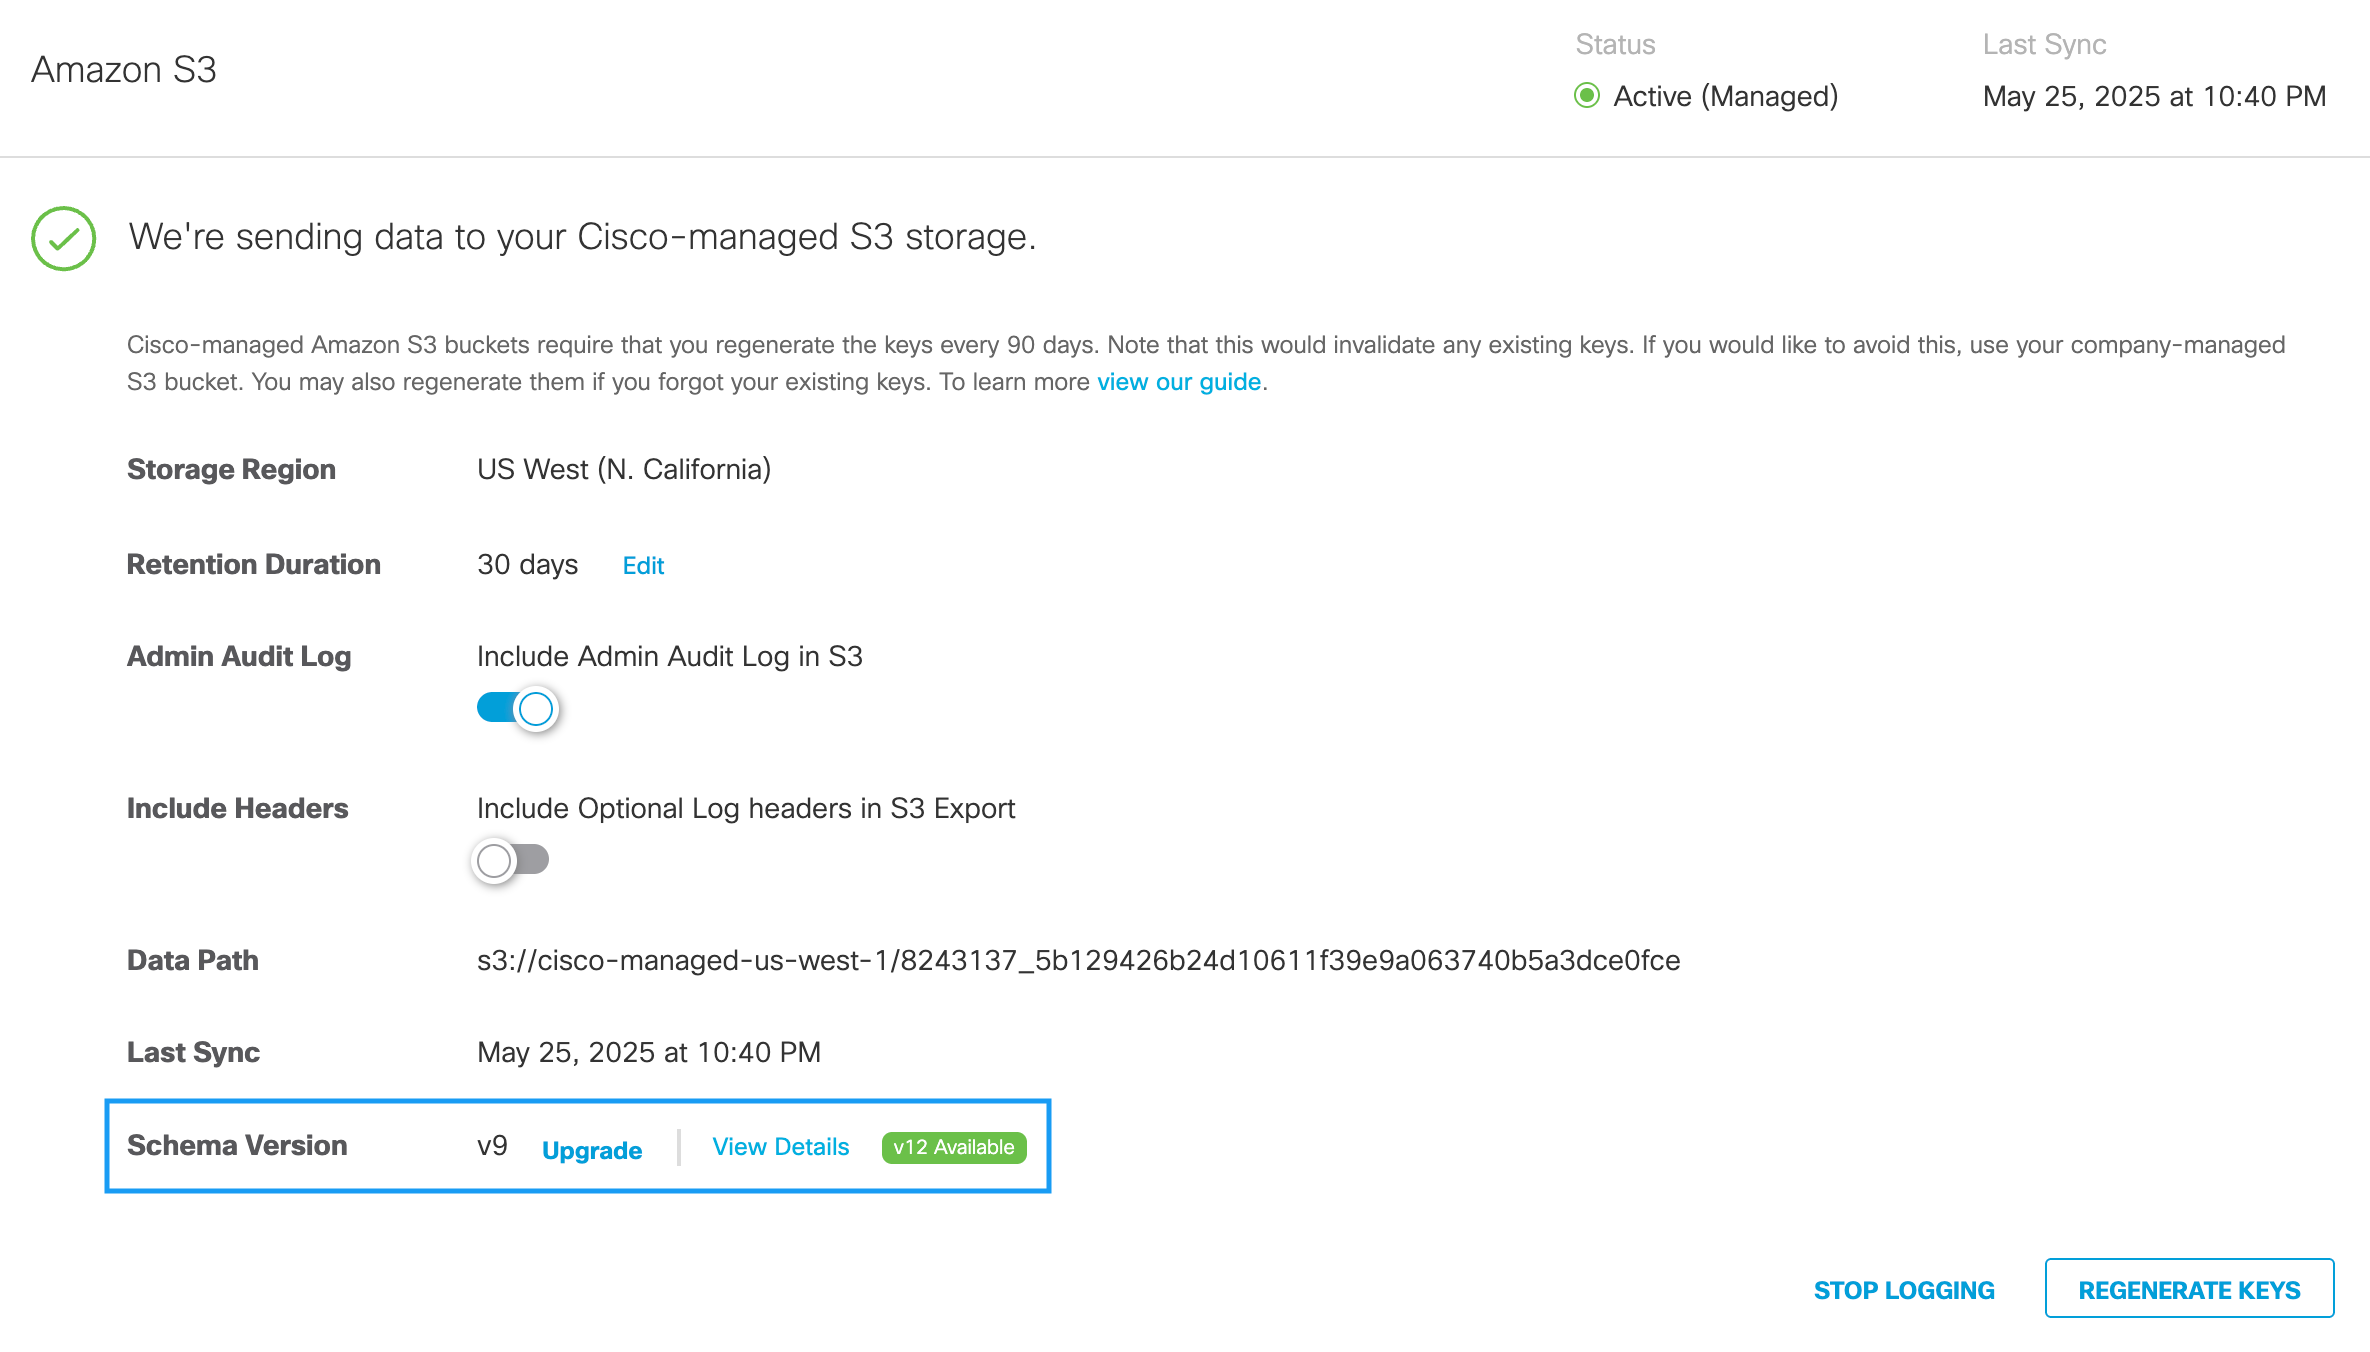
View Your Log Schema Version and Last Sync Time
- Navigate to Admin > Log Management.

- In the Amazon S3 area, view the Schema Version in use and Last Sync time.
View Your Headers
Depending on the Secure Access subscription that you have, and depending on the type of AWS S3 bucket you configure, there are different headers of the log available. Once your system is configured to include optional log headers in S3 export you can view the log headers .
View Your Headers in S3 log management
- Navigate to Admin > Log Management.
- In the Amazon S3 area, to enable the headers, click the Include Optional Log Headers in S3 Export toggle button to enable the headers in the S3 log management report.
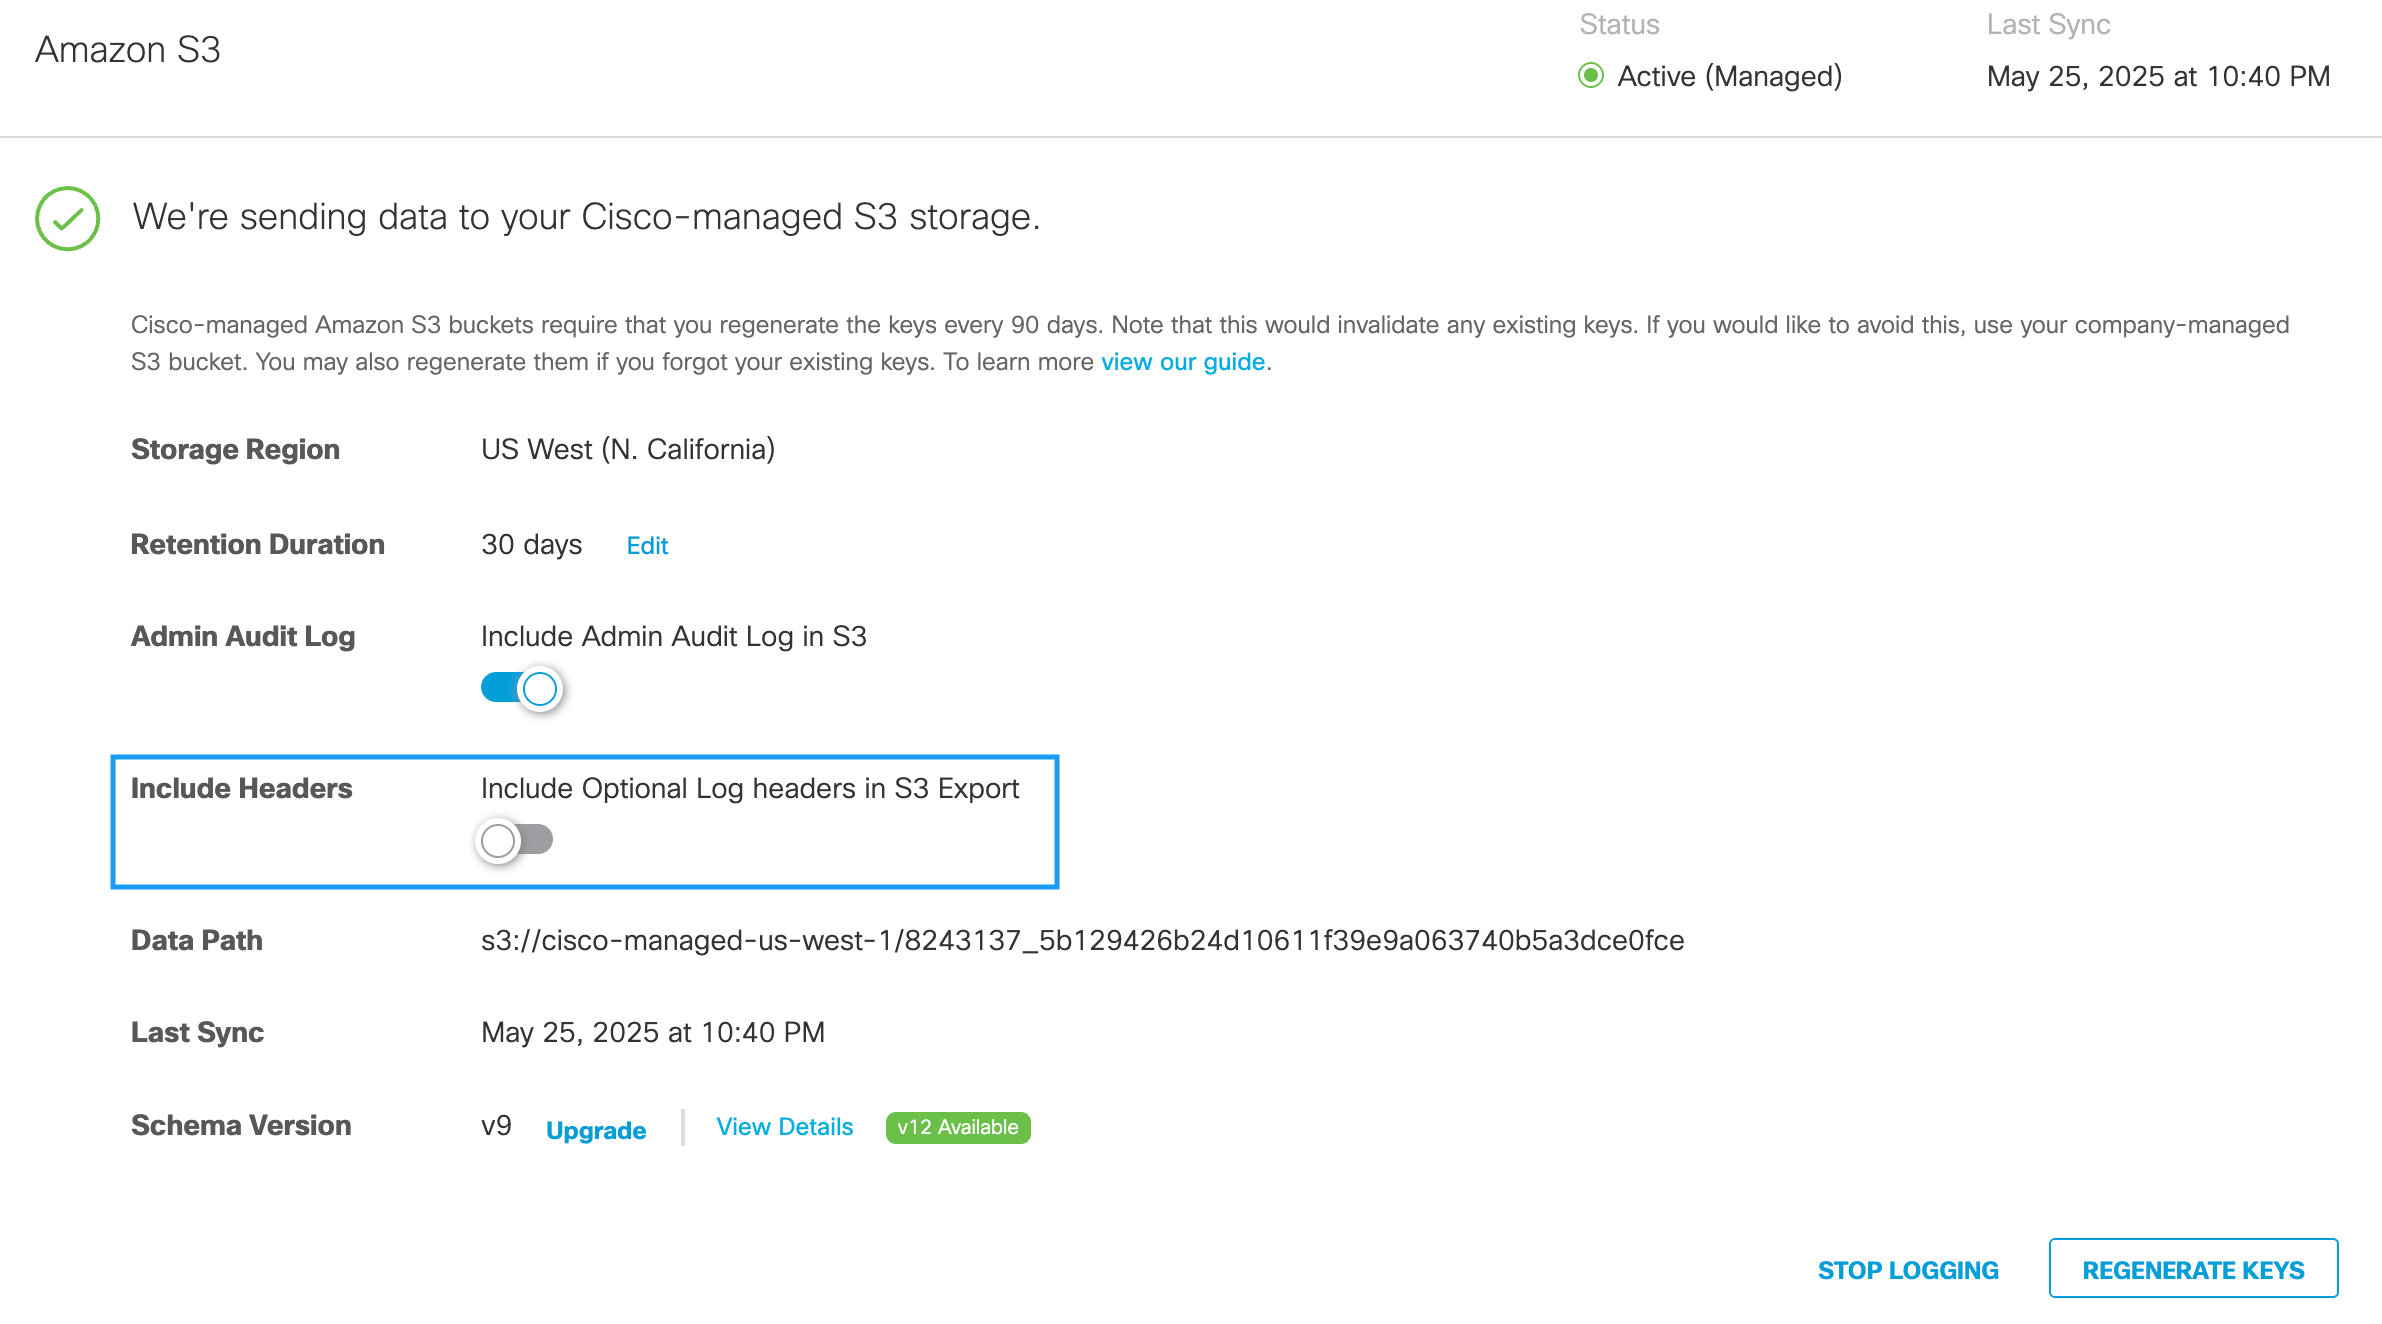
This setting will apply to all log file fields, similar to versioning, and the headers will start appearing from the next file onward.
Log File Fields
Each type of Umbrella log contains various log fields. Not all field values are available in every log record. When a field does not have a value, Umbrella sets the field to the empty string ("").
Estimate the Size of Your Logs
The size of your S3 logs depends on the number of events that occur and the volume of the traffic in your organization.
- Download one of your Umbrella log files. The Umbrella log file is a comma-separated values (CSV) file.
- Count the number of rows in the CSV file minus one for the header row.
The number of rows is equivalent to the number of events in the twenty-four hour period. - Multiply the number of rows of data by the number of bytes of data listed in a single row in the file.
The result is the estimate of the size of the event log recorded for one day.
Estimate the Size of an Exported Report
The size of your S3 logs depends on the number of events that occur, which is dependent on the volume of your traffic. The size of each log line varies based on a number of items—for example, the length of the domain name or the number of categories. Assuming each log line is 220 bytes, a million requests would be 220 MB.
- In the Umbrella dashboard, navigate to Reporting > Activity Search.

- Under Filters, run a report for the last 24 hours and then click the Export CSV icon.

- Open the downloaded .csv file. The number of rows (minus one for the header) is the number of DNS queries per day; multiply that by 220 bytes to get the estimate for one day.
Delete Logs < Log Formats and Versioning > Admin Audit Log Formats
Updated 4 months ago