Activity Search Report
The Activity Search report helps you find the result of every DNS, URL, and IP request from your various identities, ordered in descending date and time. It lists all security (and non-security) related activity within the identities reporting to Umbrella for the selected time and also allows you to refine your search using filters to see only what you need to see. This can greatly assist you in determining if there are any security issues you may have within your organization that requires your attention.
By clicking an identity or destination, you can quickly pivot from this report to the Top Identities and the Top Destinations Reports. Each report can also lead you to the Identity Details and Destination Details reports as well for further information on individual identities and destinations.
Table of Contents
- Prerequisites
- View the Activity Search Report
- Configure Columns to Display
- View Actions
- Save Activity Search Report Columns and Filters for Future Use
- Schedule an Activity Search Report
- Use Search and Advanced Search
Prerequisites
- A minimum of Read Only access to the Umbrella dashboard. See Manage User Roles.
View the Activity Search Report
- Navigate to Reporting > Core Reports > Activity Search.
This takes you to the default view of the Activity Search report, which lists all of your identities and the internet requests, or traffic events for your organization tracked over time. The default is 24 hours.
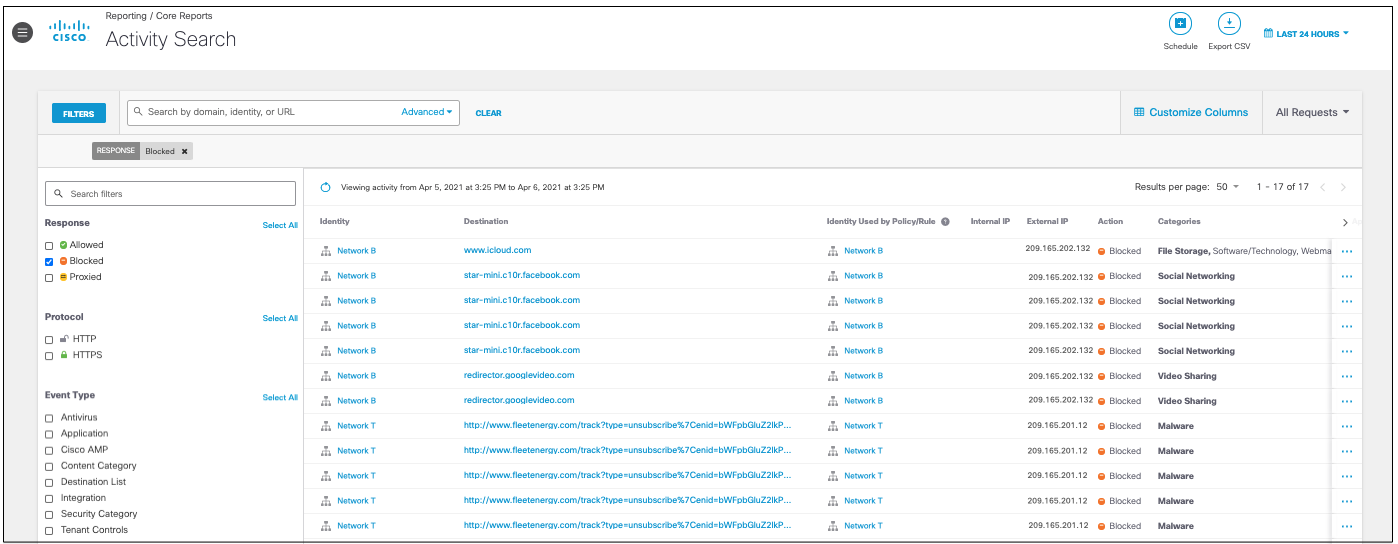
- Choose a time frame to view the report. You can view the results for the last 24 hours (default), Yesterday, Last 7 Days, Last 30 Days, or a Custom range.
Note: If your data for the last 30 days is significant, we recommend exporting S3 logs. For more information see Manage Your Logs.
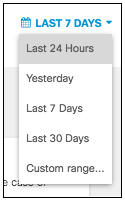
- Filter results by the response type.
Select Allowed, Blocked, or Proxied. By default, nothing is selected, so all responses are shown.

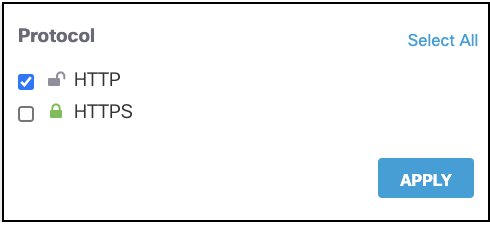
- Select either HTTP or HTTPS protocol. By default neither are selected so responses for both protocols are shown.
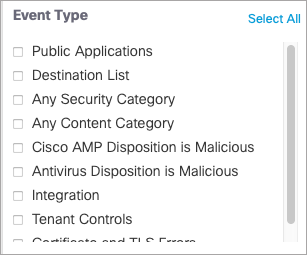
- Filter by event type. By default, none are selected so responses for all event types are shown.
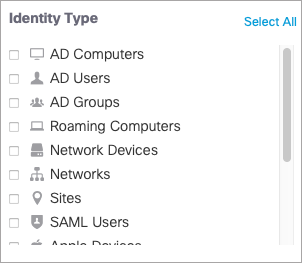
- Filter by identity types.
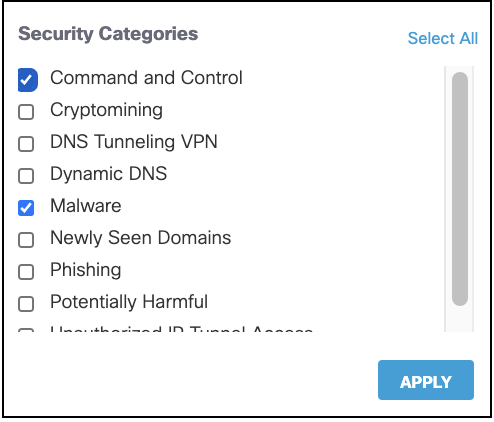
- Filter by security categories.
For more information about security categories, see Security Categories.
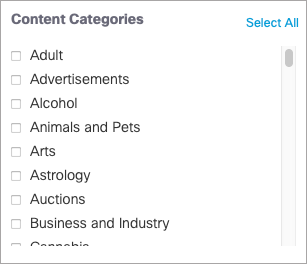
- Filter by content categories.
For a full list of content categories, see Content Category Definitions.
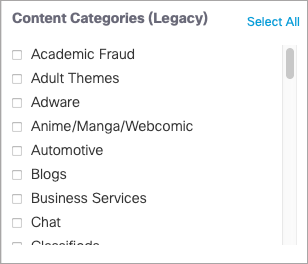
You can also filter by legacy content categories. For a full list of legacy content categories, see Legacy Content Category Definitions.
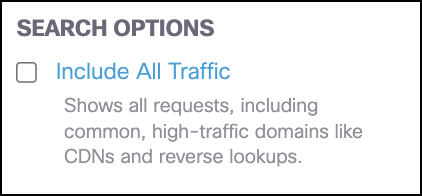
- Choose to optionally filter results by search options.
- Include All Traffic—Includes data from all domains including high-traffic domains that are filtered out by default.
Configure Columns to Display
To change the layout of the data presented in the Activity Search Report, select Customize Columns and then check or clear the information you want to see displayed and click Apply. You can also drag and drop items in the list to reorder their position on the page.
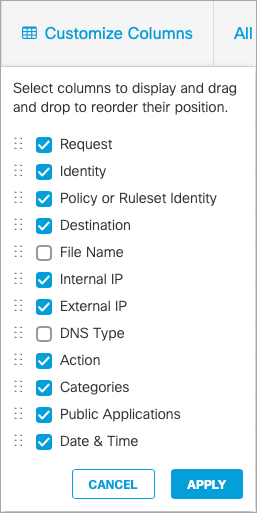
- Action—The activity is either Blocked or Allowed.
- Categories—Content and Security Categories flagged with the activity.
- Date & Time—The date and time stamp of the activity.
- Destination—The destination of the activity.
- DNS Type—The record type for the DNS request.
- External IP—The external IP address for the activity.
- File Name—The name of the file involved with the activity where applicable.
File Name
File Name will only populate for traffic matching policies with File Type Control or File Inspection enabled (you can enable File Type Control without blocking any file types by clicking enable and saving the policy). If none of the policies have File Type Control enabled, then the file name and extension fields will remain blank.
- Identity—The identity which performed the activity.
- Internal IP—The internal IP address for the activity.
- Policy or Ruleset Identity—The identity used to determine which policy applied to this activity.
- Public Applications—What application is involved with the activity, when applicable. The Public Application field will only populate for traffic matching policies with Application Controls enabled. If no policies have Application Control enabled, the field will remain blank.
- Request—When All Requests is selected, this column displays the type of request for each event.
From your search results, you can click an identity or destination and go to their respective Identity Details or Destination Details reports.
View Actions
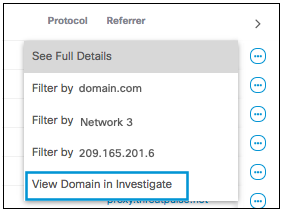
To learn more about the results of your activity search, click the View Actions icon (the blue ellipsis at the right of each item in the search results) for a result and choose an item from the menu.
See Full Details
With View Actions, you can view the full details of each activity result:
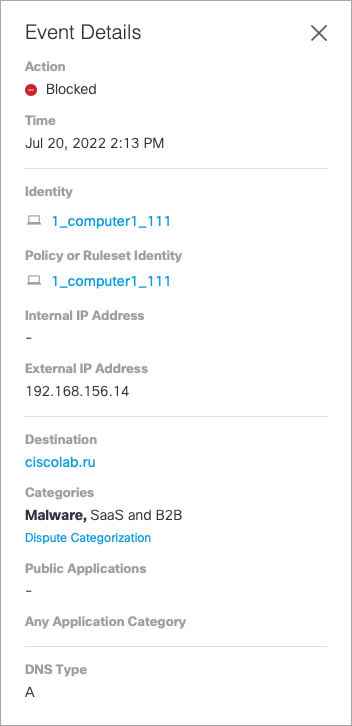
The detail fields available depend on the type of event.
Filter Views
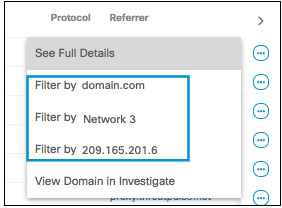
Where applicable, certain results can be filtered by the following:
- Filter by Application
- Filter by Destination
- Filter by URL
- Filter by Identity
- Filter by External IP
Note:
- The URL filter applies only to proxy or web requests, whereas the domain filter applies to both DNS and proxy or web requests.
- The Destination column displays either a URL (for example, https://example.com/profile/log/info) or a domain (for example, www.google.com)
- To filter URLs in the Destination column, use the URL filter. To filter domains in the Destination column, use the domain filter.
Investigate View
If you have an Investigate license, you may also have the option to view further details of the domain or URL in Investigate.
Save Activity Search Report Columns and Filters for Future Use
When you apply a filter to the Activity Search Report, or select specific columns for display, you can save those selections so they can be used again in the future without making the individual selections again.
When you apply a filter or select columns, a SAVE SEARCH button appears on the Activity Search page.
You can use apply any combination of filters and columns. In the example below the filter applied is Response = Allowed, and the columns selected are , Identity, Policy or Ruleset Identity, Destination, Internal IP, External IP, and Date & Time.
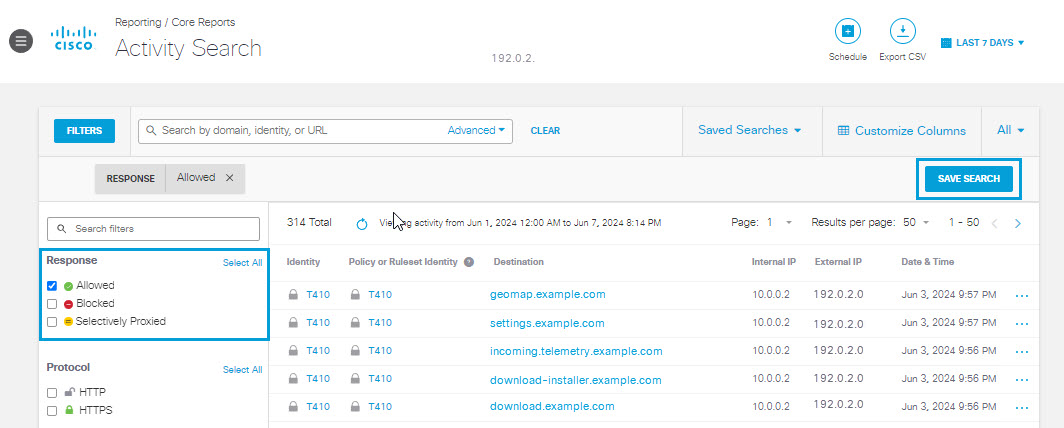
1.) Click the SAVE SEARCH button.
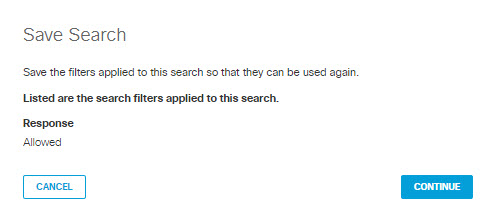
2.) In the dialog that appears, review the filters to be applied to the saved search. If they are correct, click CONTINUE. Otherwise click CANCEL.
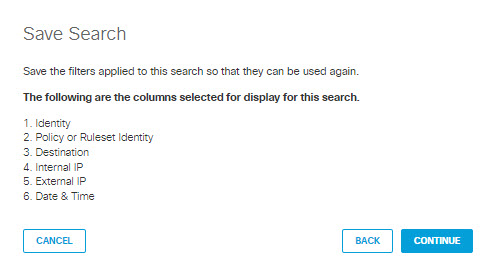
3.) In the dialog that appears, review the columns selected for the saved search. If they are correct, click CONTINUE. Otherwise click CANCEL.
4.) In the dialog that appears, give your saved search a good mnemonic name and description. Click SAVE.
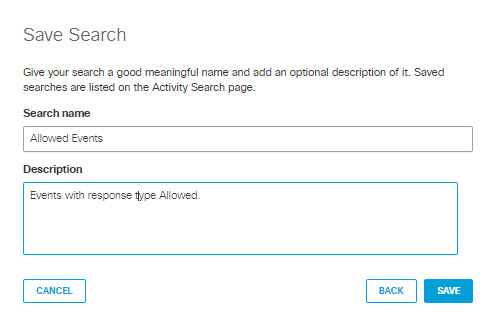
Your saved activity search report will be accessible from the Saved Searches drop-down menu on the Activity Search page. Select a saved report to apply its filter and column criteria to the Activity Search results at any time.
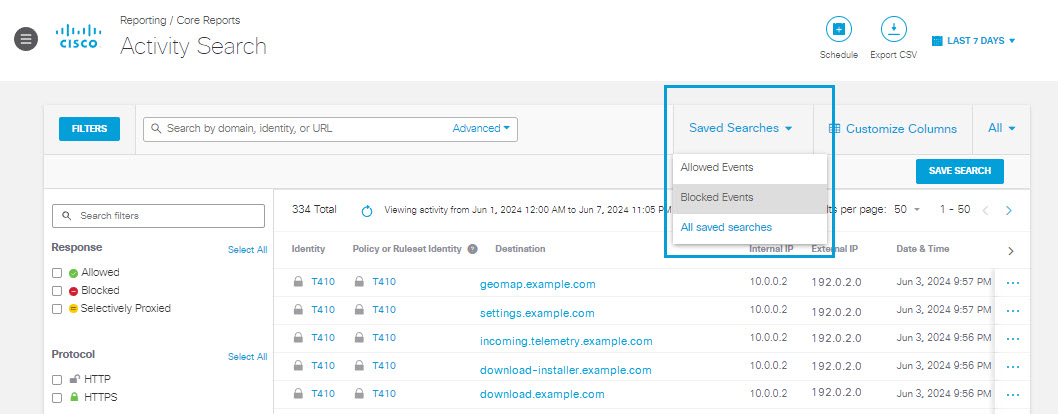
Select All saved searches from the drop-down menu to view and edit all saved searches.

Schedule an Activity Search Report
You can schedule a report to be emailed to you at regular intervals. Your emailed report is a table showing an HTML version of the report and an attached CSV file containing the entire data set. Also included in your email is a link to a live version of the same report. For more about scheduled reports, see Schedule a Report.
When scheduling a new report for Activity Search, any current filters selected will apply.
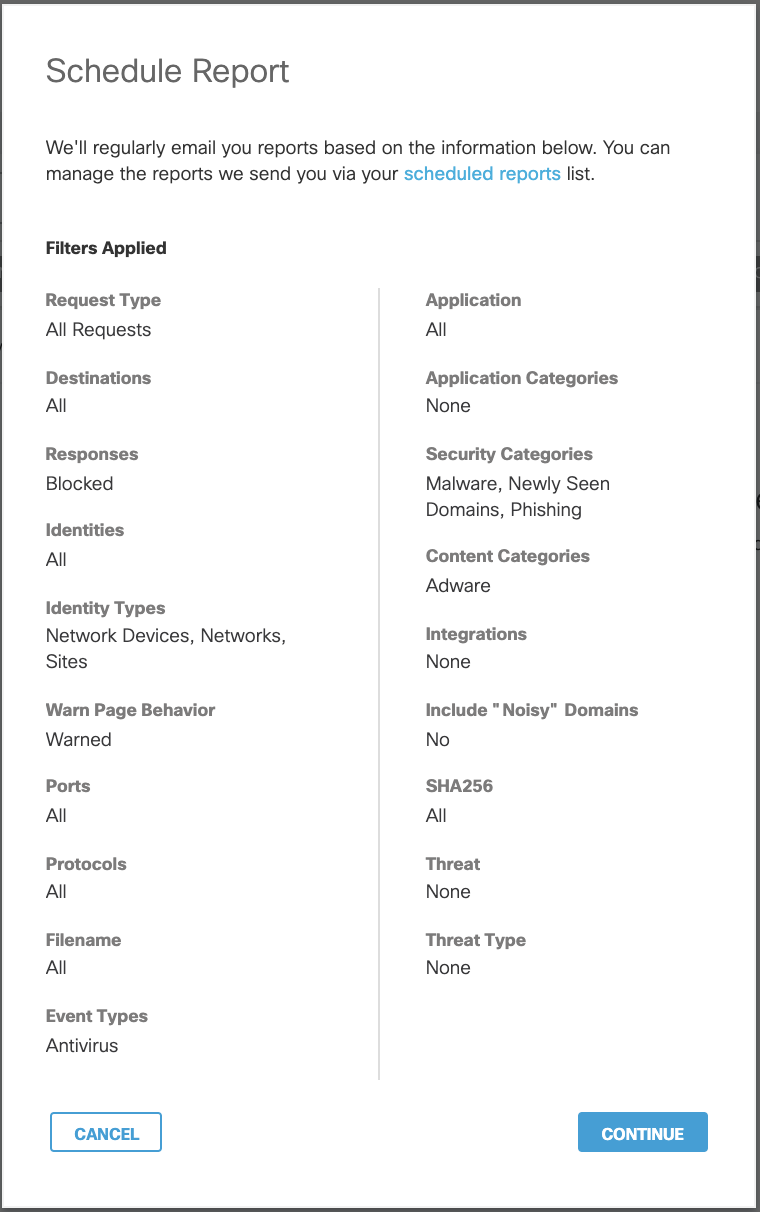
Security Activity Report < Activity Search Report > Use Search and Advanced Search
Updated 5 months ago
